Am trying to create a report and am struggling with the layout of it: I try to keep title and graphs and/or table on the same page (just as you can do in - for instance - a Ms Access report). Any suggestions?
If you want to output the model title and graphic on the same page and the next model with the same information (title + graphic) on the next page, then you must enter a text field below the graphic.
Enter a line break behind the graphic data field and then insert a Text field, select page break and select then the Okay button. Now you will get an extra page for every model.
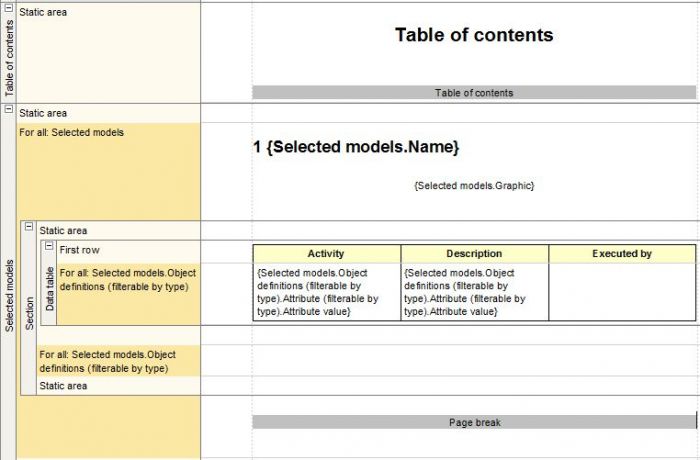
However what I want is that for each section title, graphic and table are on the same page and not separated.
I try to explain with the screenshots underneath: The first and second one should stick together (I assume the section Break (Next Page) should disappear to get at that point.
The last screenshot shows how I currently have configured it in the design view.
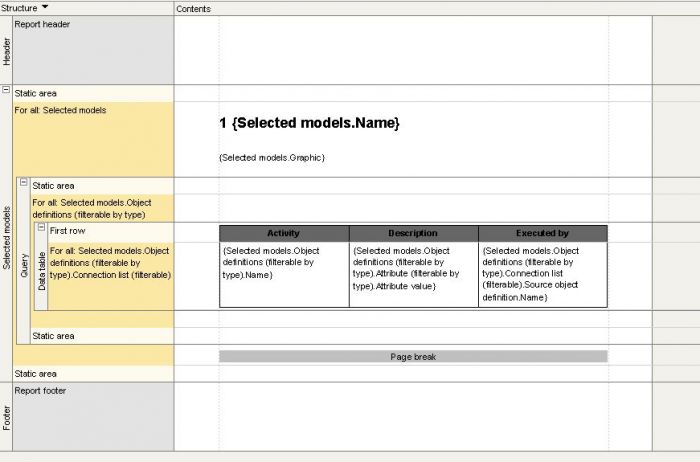
You don't need a new section, just insert a data table with the information you want to have into the section of Selected models and enter a Page break behind the data table in the section of Selected models. It should look like the following picture.
How can I fill the right column ("Executed by" ) of the table shown above with the executing persons? Could you please help me to find the right selection for the data field?
I have tried all the settings shown here and they are exactly the same as explined by you but when i run the report , data table does'nt come out in report and also i want to include all the objects attached to function i.e. Position, application system type , events etc. in teh given EPC.