
Process models are not just created to fill office walls with big model printouts, but also to perform analysis. One possibility how I can analyze relationships is to use for example a CRUD matrix or RASCI charts.
CRUD
The CRUD matrix is a visualisation of relationships. It contains for example details of which programs interact with which data and in what way.
CRUD stands for:
C= Create
R= Read
U=Update
D=Delete
The purpose of this matrix is to illustrate the relationships between business processes and the data they use.
Another possibility to analyze relationships is the RASCI chart.
RASCI
A RASCI chart is a matrix of responsibilities. RASCI describes competence and liability for projects or business processes and answers the following questions:
- Who is involved?
- How is someone involved?
- Which activities are executed?
- Are activities executed in an active or passive manner?
RASCI stand for:
R = Responsible, the person who is responsible for the execution or the delegation of activities.
A = Accountable, the person who is in charge of the activity
S = Supportive, the person has a subsidiary role and makes utilities available
C = Consulted, a specialist who gives advice
I = Informed, a person who is informed of the process of activities or has the authorization of being informed
The purpose of the chart is a definite classification of project activities to persons or business units.
Configurable Network Analysis
Creating for example a CRUD matrix or a RASCI chart for a business process can be a labor intensive task. To simplify such tasks, I am sharing with you today a free-of-charge ARIS report, which is called “Configurable Network Analysis”.
The ARIS report evaluates complex networks. It helps me to understand who/ what is (indirectly) relevant for whom/ what and gives answers to questions like:
- Who is involved in which process and for which process step? (RASCI-analysis)
- Who is delivering or requiring which products or services?
- Which IT systems are used where and by whom?
- Which data is relevant for which IT systems?
With the “Configurable Network Analysis” I have a method to analyze relationships between objects (network) in ARIS. It is configurable, because for example I could choose groups or models to get a network analysis about the selected group or models. In addition, I can define various options before executing the report.
Benefits of using Configurable Network Analysis
Evaluating complex networks gets much easier by using the”Configurable Network Analysis” report. A configurable user-friendly setup provides you with easy to understand information. You get aggregated views as well as graphics of selected models, too. Furthermore, you need no programming experience to run the report. Altogether a simple handling: it is a click and go analysis.
Report Download & Setup
To get started, download the ARIS Network Analysis report and save it on your hard disk. Please note, you can only download the report if you are currently logged in to ARIS Community.
Make sure that you are using ARIS Business Architect, because you need the administration module to import the report. In case you only got ARIS Business Designer on your machine, you must ask your ARIS administrator to install the report for you.
To get more information about downloading & setting up reports and macros in ARIS, read this previous article “Reports and macros in ARIS” by my colleague.
Running the report
When you run the report, you first configure the intended analysis. It depends on the options, which information is included in the report.
First, you select an evaluation aspect, which defines how the relevant objects of the selected model will be evaluated. The report is able to evaluate direct relationships like the relationship between Function and Person. It can also evaluate indirect relationships like Application system – Function – Person type.
The report analyses the selected model, but it can include additional models. It depends on the value of the options “Include subgroups”, “Include FADs” (Function Allocation diagrams), “Include interfaces” and “Assignment level”, which other models are included in the analysis.
The report can operate on definition level or occurrence level. In addition, you can define which column is used for sorting the results. Finally, you can specify if symbol names should be included in the output, too.
If you select ”Output models”, all models which are in relationship with the selected model will be included in the output sheets. An overview sheet called “Model sequence” will be included, too.
If the report does not find any direct or indirect relationships based on the defined evaluation criteria, the report informs you with a message.
Report output
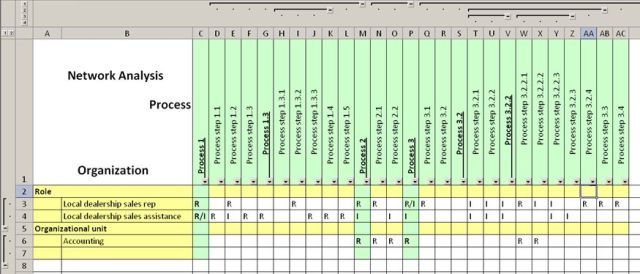
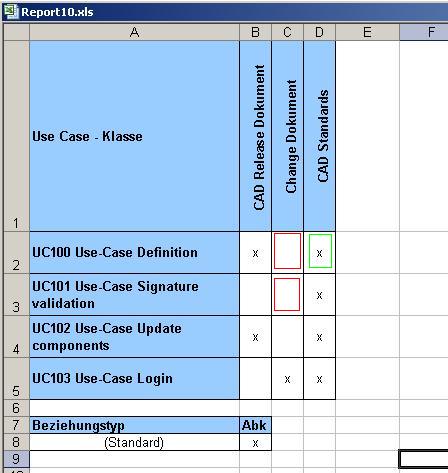
After download and installation, you can execute the report. The report will always generate a spreadsheet. The Microsoft Excel output provides information about relevant objects of the selected models based on the defined evaluation aspects. The report gathers all models/ symbols/ objects in scope, places them in rows (the first evaluation aspect) and columns (second evaluation aspect) like in the following picture (evaluation aspect: Organization/Process).
I hope you find this report useful. Please let me know how you are using it and what kind of analysis you are running.
Note: Check this post if you are looking for other free ARIS reports & macros. If you want to discuss ARIS scripting problems, make sure to join the group Reports & Macros in ARIS.
I am confident that this is great stuff.
However, when I try to import the downloaded file, I get an import script error message that says "The script Model_Comparison.arx could not be imported. The script belongs to another "evaluation component" ("Auswertungskomponente" in German).
I browsed the .zip-file and could not find any information that would clarify this evaluation component issue. I tried to import to a macro-subfolder. One, I created from scratch, but also to existing ones (actually, all that I have available), all with the same result...
It surprises me that the file format seems to be related to version 7.0.xxx (at least my import dialog says so) and not 7.1.xxx.
I am using the BizArch Version 7.1.0.452596 (SR 2010_05) and I am also asking why this version infomation can not be copied from the info-dialog.
"The script belongs to another "evaluation component" ("Auswertungskomponente" in German)."
This error message means that you are trying to import the file to the wrong place.
"I browsed the .zip-file and could not find any information that would clarify this evaluation component issue. I tried to import to a macro-subfolder."
The script Model Comparison is no macro. It is a report and you must import the file to a report folder. Read this previous article “Reports and macros in ARIS” by my colleague.
Eva,
thanks for clarifying this!
However, for someone who is ignorant to read your headlines like "Report output" carefully, your colleague's article is of little help either ;-) This is close to guess from the dialog information on "Auswertungskomponente" the root cause of the problem. It seems hard to have dialogs with information that help even me to identify solutions...
Another thing that I experienced differently is "The report will always generate a spreadsheet." According to the dialog "The output file can not be generated. There are too many edges" (alternatively "There are no edges that match the choosen aspect."), I was unable. The points in live where Obelix says *hmpf*. What is the upper bound in terms of objects / associated models?
And to proof that I am not unable all the time...in the spreadsheet I successfully generated, I see chances for optiomization to satisfy dumb users like me or ... management: A legend for the one letter relationship indicator. In my process-data matrix. It took me some time to figure out that the acronyms are not identical to one of the CRUD or RASCI stuff.
Take care,
Stefan
Hi Eva,
Really appreciate posting this one -- I have a basic query... We have a need to create a similar one...
- Can this be attempted thru the Report Script Wizards (WYSIWYG) ?
Or
- Is it only possible thru direct script (code) only and not possible thru Script Wizard ?
Hi,
this problem only appears in Internet Explorer 8. IE8 seems to guess the filetype and renames the file to *.zip. As a quick fix, you can download the file, save it to the desktop and rename it. It is important that the file has the ending "arx". Now you can import the file. How it works is described in the article "Reports and macros in ARIS" by Torsten Haase.
Regards,
Eva
Hi Eva,
Thanks for this report.
I have imported the Configurable_relationship_analysis.arx file to reports .
I am running this file on EPC.
Its not fetching the Accountable from FADs ( Function Allocation Diagram)
The report is fetching Responsible , Consulted ,Informed except from Accountable.
Please help.
Hi Arzu,
the report has only german and english language files. You can solve this problem by adding a turkish language file. You can read how this works in the article "Aris Scripting Tutorial - Part 5 - Object Attributes - All Output Formats and Multilanguage" by Volker Eckardt.
Regards,
Eva
Hallo,
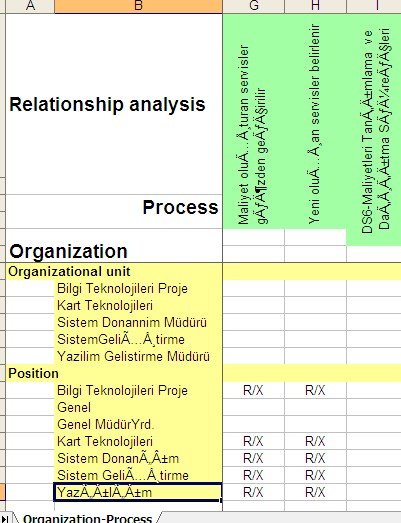
ich habe auch ein Problem mit der Sprache bzw. dem Zeichensatz. Der Report "Konfiguriere Beziehugnsmatrix" wird ohne Probleme ausgeführt. Leider werden die Umlaute z.B. in den Rollennamen nicht korrekt ausgegeben.
| Rolle | ||
| p bestimmt mit | R | |
| p entscheidet über | R | |
| p führt aus | R | |
Was muss im Skript umgestellt werden, dass die deuteschenUmlaute richtig dargestellt werden. Aus anderen Skripten kenne ich das Problem nicht.
Über eine Antwort würde ich mich freuen.
Vielen Dank und schöne Grüße
Beate Kunadt
Hi Eva;
first of all; thank you for this stuff, this is really good work.
I have also a related question about Matrix report and Matrix diagrams. Is this somehow possible to make this procedure backwards?
Could we also export an Excel sheet due to your report and modify it, & after that import it back into ARIS with modificated relations?
I just wanna explain my question with screenshots, I am sure than you will understand me better.
For example I have this matrix diagram in ARIS...
Then I can call your report or another one, which convert my matrix into the Excel Sheet.
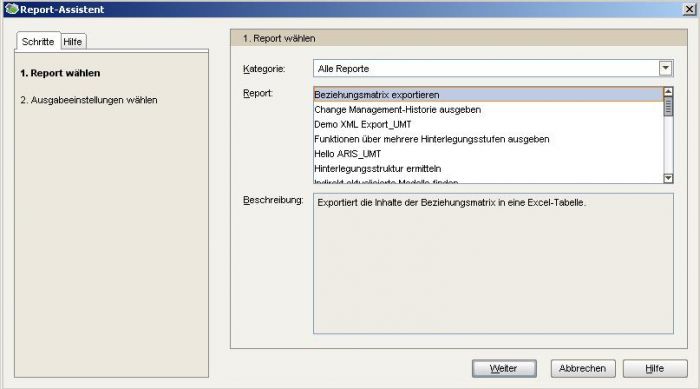
Then I call for example the report "Export the relation matrix" (I am not sure about the english name but in german that's "Beziehungsmatrix exportieren"
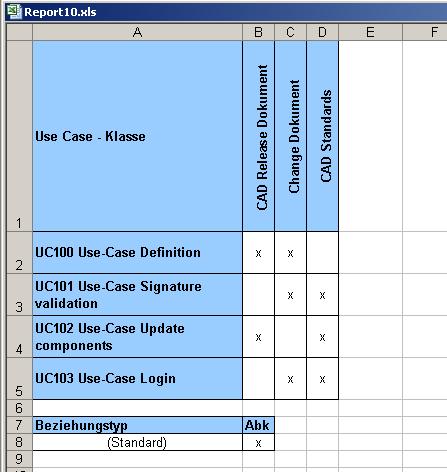
Now I have exactly my matrix on Excel. Perfect.
What I wanna do is; just change the relationships on Excel manually, and import it in ARIS back, so that I have my modificated matrix diagram in ARIS. (Just like the macro Process Generator)
Is there any Report to realise this?
If not; could you please give some code examples to solve this problem.?
I am sure , this would be extremely useful for all ARIS Users (Especially for the ARIS Report beginners like me).
Thank you in advance for your attention.
Greetings
Umut Oezleyen
The reason for this is that you are using a notation that does not know organizational elements (BPMN). You might want to read my article here (http://www.ariscommunity.com/users/roland-woldt/2010-11-28-learning-bpmn-1-what-bpmn) and then redo your process in EPCs with FADs as needed.
Hello Eva,
I ran that report on a matrix model, where connections between objects have been defined on definition level. These connections (aspect: Process/Data) are not evaluated in the report at all. Why is this so?
I also noticed that in the report there is a function
function getOccsByDef( p_aOccs)
which is not called from any line of code. Could this function be linked to the aforementioned problem? Do you have any advice?
Regards
Hubert
Hello Eva,
This thread is quite interesting. I am trying to apply the RA(S)CI notation a bit further, by showing in our EPC the connections between human actors and functions as a one-letter RASCI code instead of the type. For example, an "I" instead of a "must be informed about", which is visually more powerful.
I can easily do this by hand by placing a new attribute called "RASCI_Letter" instead of the type in the connection template. I wish I had a script to automatically (i.e. scriptrunner) assign the correct RASCI letter to the new attribute based upon the relation type, but this seems beyond my scripting skills on connections (!) Would you have a script sample doing something similar ?
Best regards
Thierry
Hello again.
I did not know if was so easy to do: after reading the brillant "Macro & report tutorials", I was able to update the customized RASCI_Letter attribute. The script below is based on (a) extracting all the function occurences of a model, (b) getting all the connection occurences for each function, (c) filtering out what is not for Person Type, and (d) setting the connection RASCI letter attribute.
For those interested....
Best regards,
// T. Caro
// Set the attribute RASCI_Letter 68311 to the single RASCI letter value
// for relations between Functions and Person Type
// It runs quiet.  Set an output to get a report...

var modelTypes = new Array(Constants.MT_EEPC, Constants.MT_EEPC_ROW);
var nLocale = Context.getSelectedLanguage();

function main(){
    var active_db  = new String (ArisData.getActiveDatabase());
    var db = active_db.substring(10);
    //var grp = ArisData.getActiveDatabase().FindGUID(strGroupGUID);
    var grp = ArisData.getActiveDatabase().RootGroup();
    var models = getModelsFromGroup(grp);  //ArisData.getSelectedGroups()[0]);
    setRASCILetter(models);
}

function getModelsFromGroup(group){
    var mdls = group.ModelList(true, modelTypes);
    return ArisData.sort(mdls, Constants.AT_NAME, nLocale);
}

function setRASCILetter (aModels){
    var oOutputFile = Context.createOutputObject();
//    var aModels = ArisData.getSelectedModels();

    for (var i = 0; i < aModels.length; i++) {
        oOutputFile.BeginTable(100, Constants.C_BLACK, Constants.C_TRANSPARENT, Constants.FMT_LEFT, 0);
        oOutputFile.TableRow();
        var oModel = aModels[i];                    // Current model
        var sModelName = oModel.Name(nLocale);      // Name of current model
        // get all functions
        var oFuncOccs = oModel.ObjOccListFilter(Constants.OT_FUNC);
        for (var j = 0; j < oFuncOccs.length; j++){
            var oFuncOcc = oFuncOccs[j];
            var aCxnOccs = oFuncOccs[j].Cxns(Constants.EDGES_IN);
            for(var k=0; k<aCxnOccs.length; k++){
                var nCxn = aCxnOccs[k].CxnDef().ActiveType();
                if (nCxn == "carries out") {
                    // check type of source object
                    var oSourceObjOcc = aCxnOccs[k].SourceObjOcc();
                    if (oSourceObjOcc.ObjDef().TypeNum() == Constants.OT_PERS_TYPE){
                        var Attr_68311 = aCxnOccs[k].CxnDef().Attribute(68311, nLocale);
                        var RASCI_Letter = Attr_68311.getValue();
                        if (RASCI_Letter != "R") {
                            Attr_68311.setValue("R");
                            RASCI_Letter = "R";
                            oOutputFile.TableRow();
                            oOutputFile.TableCell(sModelName, 20, getString("TEXT_1"), 10, Constants.C_BLACK, Constants.C_TRANSPARENT, 0, Constants.FMT_BOLD | Constants.FMT_LEFT | Constants.FMT_VTOP, 0);
                            var nSource = oSourceObjOcc.ObjDef().Name(nLocale);
                            oOutputFile.TableCell(nSource, 20, "Arial", 10, Constants.C_BLACK, Constants.C_TRANSPARENT, 0, Constants.FMT_BOLD | Constants.FMT_LEFT | Constants.FMT_VTOP, 0);
                            oOutputFile.TableCell(nCxn, 20, "Arial", 10, Constants.C_BLACK, Constants.C_TRANSPARENT, 0, Constants.FMT_BOLD | Constants.FMT_LEFT | Constants.FMT_VTOP, 0);
                            oOutputFile.TableCell("attribute set to "+RASCI_Letter+" for task ", 20, "Arial", 10, Constants.C_BLACK, Constants.C_TRANSPARENT, 0, Constants.FMT_BOLD | Constants.FMT_LEFT | Constants.FMT_VTOP, 0);
                            oOutputFile.TableCell(oFuncOcc.ObjDef().Name(nLocale), 20, "Arial", 10, Constants.C_BLACK, Constants.C_TRANSPARENT, 0, Constants.FMT_BOLD | Constants.FMT_LEFT | Constants.FMT_VTOP, 0);
                        }
                    }
                }
                if (nCxn == "is accountable for"){
                    // check type of source object
                    var oSourceObjOcc = aCxnOccs[k].SourceObjOcc();
                    if (oSourceObjOcc.ObjDef().TypeNum() == Constants.OT_PERS_TYPE){
                        var Attr_68311 = aCxnOccs[k].CxnDef().Attribute(68311, nLocale);
                        var RASCI_Letter = Attr_68311.getValue();
                        if (RASCI_Letter != "A") {
                            Attr_68311.setValue("A");
                            RASCI_Letter = "A";
                            oOutputFile.TableRow();
                            oOutputFile.TableCell(sModelName, 20, getString("TEXT_1"), 10, Constants.C_BLACK, Constants.C_TRANSPARENT, 0, Constants.FMT_BOLD | Constants.FMT_LEFT | Constants.FMT_VTOP, 0);
                            var nSource = oSourceObjOcc.ObjDef().Name(nLocale);
                            oOutputFile.TableCell(nSource, 20, "Arial", 10, Constants.C_BLACK, Constants.C_TRANSPARENT, 0, Constants.FMT_BOLD | Constants.FMT_LEFT | Constants.FMT_VTOP, 0);
                            var nCxn = aCxnOccs[k].CxnDef().ActiveType();
                            oOutputFile.TableCell(nCxn, 20, "Arial", 10, Constants.C_BLACK, Constants.C_TRANSPARENT, 0, Constants.FMT_BOLD | Constants.FMT_LEFT | Constants.FMT_VTOP, 0);
                            oOutputFile.TableCell("attribute set to "+RASCI_Letter+" for task ", 20, "Arial", 10, Constants.C_BLACK, Constants.C_TRANSPARENT, 0, Constants.FMT_BOLD | Constants.FMT_LEFT | Constants.FMT_VTOP, 0);
                            oOutputFile.TableCell(oFuncOcc.ObjDef().Name(nLocale), 20, "Arial", 10, Constants.C_BLACK, Constants.C_TRANSPARENT, 0, Constants.FMT_BOLD | Constants.FMT_LEFT | Constants.FMT_VTOP, 0);
                        }
                    }
                }
                if (nCxn == "contributes to"){
                    // check type of source object
                    var oSourceObjOcc = aCxnOccs[k].SourceObjOcc();
                    if (oSourceObjOcc.ObjDef().TypeNum() == Constants.OT_PERS_TYPE){
                        var Attr_68311 = aCxnOccs[k].CxnDef().Attribute(68311, nLocale);
                        var RASCI_Letter = Attr_68311.getValue();
                        if (RASCI_Letter != "C") {
                            Attr_68311.setValue("C");
                            RASCI_Letter = "C";
                            oOutputFile.TableRow();
                            oOutputFile.TableCell(sModelName, 20, getString("TEXT_1"), 10, Constants.C_BLACK, Constants.C_TRANSPARENT, 0, Constants.FMT_BOLD | Constants.FMT_LEFT | Constants.FMT_VTOP, 0);
                            var nSource = oSourceObjOcc.ObjDef().Name(nLocale);
                            oOutputFile.TableCell(nSource, 20, "Arial", 10, Constants.C_BLACK, Constants.C_TRANSPARENT, 0, Constants.FMT_BOLD | Constants.FMT_LEFT | Constants.FMT_VTOP, 0);
                            var nCxn = aCxnOccs[k].CxnDef().ActiveType();
                            oOutputFile.TableCell(nCxn, 20, "Arial", 10, Constants.C_BLACK, Constants.C_TRANSPARENT, 0, Constants.FMT_BOLD | Constants.FMT_LEFT | Constants.FMT_VTOP, 0);
                            oOutputFile.TableCell("attribute set to "+RASCI_Letter+" for task ", 20, "Arial", 10, Constants.C_BLACK, Constants.C_TRANSPARENT, 0, Constants.FMT_BOLD | Constants.FMT_LEFT | Constants.FMT_VTOP, 0);
                            oOutputFile.TableCell(oFuncOcc.ObjDef().Name(nLocale), 20, "Arial", 10, Constants.C_BLACK, Constants.C_TRANSPARENT, 0, Constants.FMT_BOLD | Constants.FMT_LEFT | Constants.FMT_VTOP, 0);
                        }
                    }
                }
                if (nCxn == "must be informed about"){
                    // check type of source object
                    var oSourceObjOcc = aCxnOccs[k].SourceObjOcc();
                    if (oSourceObjOcc.ObjDef().TypeNum() == Constants.OT_PERS_TYPE){
                        var Attr_68311 = aCxnOccs[k].CxnDef().Attribute(68311, nLocale);
                        var RASCI_Letter = Attr_68311.getValue();
                        if (RASCI_Letter != "I") {
                            Attr_68311.setValue("I");
                            RASCI_Letter = "I";
                            oOutputFile.TableRow();
                            oOutputFile.TableCell(sModelName, 20, getString("TEXT_1"), 10, Constants.C_BLACK, Constants.C_TRANSPARENT, 0, Constants.FMT_BOLD | Constants.FMT_LEFT | Constants.FMT_VTOP, 0);
                            var nSource = oSourceObjOcc.ObjDef().Name(nLocale);
                            oOutputFile.TableCell(nSource, 20, "Arial", 10, Constants.C_BLACK, Constants.C_TRANSPARENT, 0, Constants.FMT_BOLD | Constants.FMT_LEFT | Constants.FMT_VTOP, 0);
                            var nCxn = aCxnOccs[k].CxnDef().ActiveType();
                            oOutputFile.TableCell(nCxn, 20, "Arial", 10, Constants.C_BLACK, Constants.C_TRANSPARENT, 0, Constants.FMT_BOLD | Constants.FMT_LEFT | Constants.FMT_VTOP, 0);
                            oOutputFile.TableCell("attribute set to "+RASCI_Letter+" for task ", 20, "Arial", 10, Constants.C_BLACK, Constants.C_TRANSPARENT, 0, Constants.FMT_BOLD | Constants.FMT_LEFT | Constants.FMT_VTOP, 0);
                            oOutputFile.TableCell(oFuncOcc.ObjDef().Name(nLocale), 20, "Arial", 10, Constants.C_BLACK, Constants.C_TRANSPARENT, 0, Constants.FMT_BOLD | Constants.FMT_LEFT | Constants.FMT_VTOP, 0);
                        }
                    }
                }
            }
        }
        oOutputFile.EndTable(sModelName+" was processed successfuly", 100, "Arial", 10, Constants.C_BLACK, Constants.C_TRANSPARENT, 0, Constants.FMT_LEFT | Constants.FMT_VTOP, 0);
    }
    oOutputFile.WriteReport();
}
main();
Thanks for this report.
I have imported the Configurable_relationship_analysis.arx file to reports .
I am running this file on EPC.
Its not fetching the Accountable from FADs ( Function Allocation Diagram)
The report is fetching Responsible , Consulted ,Informed except from Accountable.
Please help.
Regads
Puru





.jpg)



.jpg)


