
Process models are not just created to fill office walls with big model printouts, but also to perform analysis. One possibility how I can analyze relationships is to use for example a CRUD matrix or RASCI charts.
CRUD
The CRUD matrix is a visualisation of relationships. It contains for example details of which programs interact with which data and in what way.
CRUD stands for:
C= Create
R= Read
U=Update
D=Delete
The purpose of this matrix is to illustrate the relationships between business processes and the data they use.
Another possibility to analyze relationships is the RASCI chart.
RASCI
A RASCI chart is a matrix of responsibilities. RASCI describes competence and liability for projects or business processes and answers the following questions:
- Who is involved?
- How is someone involved?
- Which activities are executed?
- Are activities executed in an active or passive manner?
RASCI stand for:
R = Responsible, the person who is responsible for the execution or the delegation of activities.
A = Accountable, the person who is in charge of the activity
S = Supportive, the person has a subsidiary role and makes utilities available
C = Consulted, a specialist who gives advice
I = Informed, a person who is informed of the process of activities or has the authorization of being informed
The purpose of the chart is a definite classification of project activities to persons or business units.
Configurable Network Analysis
Creating for example a CRUD matrix or a RASCI chart for a business process can be a labor intensive task. To simplify such tasks, I am sharing with you today a free-of-charge ARIS report, which is called “Configurable Network Analysis”.
The ARIS report evaluates complex networks. It helps me to understand who/ what is (indirectly) relevant for whom/ what and gives answers to questions like:
- Who is involved in which process and for which process step? (RASCI-analysis)
- Who is delivering or requiring which products or services?
- Which IT systems are used where and by whom?
- Which data is relevant for which IT systems?
With the “Configurable Network Analysis” I have a method to analyze relationships between objects (network) in ARIS. It is configurable, because for example I could choose groups or models to get a network analysis about the selected group or models. In addition, I can define various options before executing the report.
Benefits of using Configurable Network Analysis
Evaluating complex networks gets much easier by using the”Configurable Network Analysis” report. A configurable user-friendly setup provides you with easy to understand information. You get aggregated views as well as graphics of selected models, too. Furthermore, you need no programming experience to run the report. Altogether a simple handling: it is a click and go analysis.
Report Download & Setup
To get started, download the ARIS Network Analysis report and save it on your hard disk. Please note, you can only download the report if you are currently logged in to ARIS Community.
Make sure that you are using ARIS Business Architect, because you need the administration module to import the report. In case you only got ARIS Business Designer on your machine, you must ask your ARIS administrator to install the report for you.
To get more information about downloading & setting up reports and macros in ARIS, read this previous article “Reports and macros in ARIS” by my colleague.
Running the report
When you run the report, you first configure the intended analysis. It depends on the options, which information is included in the report.
First, you select an evaluation aspect, which defines how the relevant objects of the selected model will be evaluated. The report is able to evaluate direct relationships like the relationship between Function and Person. It can also evaluate indirect relationships like Application system – Function – Person type.
The report analyses the selected model, but it can include additional models. It depends on the value of the options “Include subgroups”, “Include FADs” (Function Allocation diagrams), “Include interfaces” and “Assignment level”, which other models are included in the analysis.
The report can operate on definition level or occurrence level. In addition, you can define which column is used for sorting the results. Finally, you can specify if symbol names should be included in the output, too.

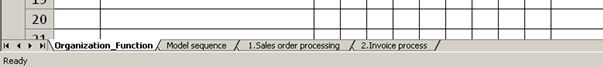
If you select ”Output models”, all models which are in relationship with the selected model will be included in the output sheets. An overview sheet called “Model sequence” will be included, too.
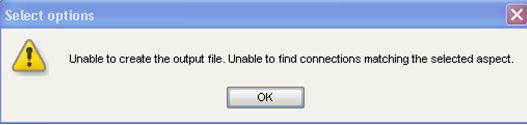
If the report does not find any direct or indirect relationships based on the defined evaluation criteria, the report informs you with a message.
Report output
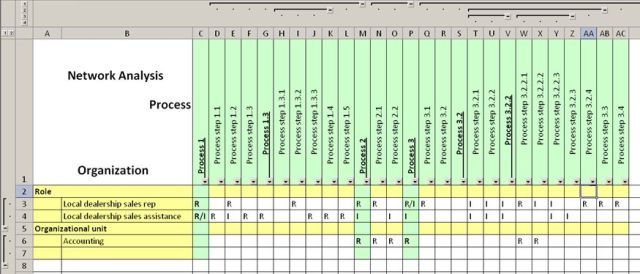
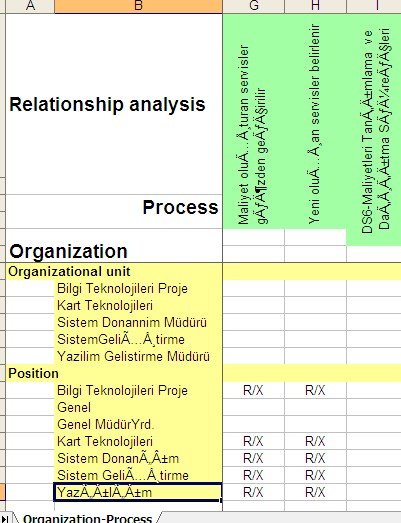
After download and installation, you can execute the report. The report will always generate a spreadsheet. The Microsoft Excel output provides information about relevant objects of the selected models based on the defined evaluation aspects. The report gathers all models/ symbols/ objects in scope, places them in rows (the first evaluation aspect) and columns (second evaluation aspect) like in the following picture (evaluation aspect: Organization/Process).
I hope you find this report useful. Please let me know how you are using it and what kind of analysis you are running.
Note: Check this post if you are looking for other free ARIS reports & macros. If you want to discuss ARIS scripting problems, make sure to join the group Reports & Macros in ARIS.


.jpg)
Donald Dillon on
This is great stuff, but I suspect it only works in 7.1. Please confirm. Maybe IDS can include this in the communications about these new features/reports. I expect there are still many older versions in use around the globe.
thanks
dhd