In the last HowTo we created routes. Today, I'd like to show you how to select a complete area and color it. This function is similar to a vector map because you can also differentiate between the areas using thresholds.
First, you need the coordinates for the area. That's why I used the web service Get Lat Lon, as I already did in my first Google Maps post to determine the geocoordinates.
Then, open the feed editor and add your Excel document to it.
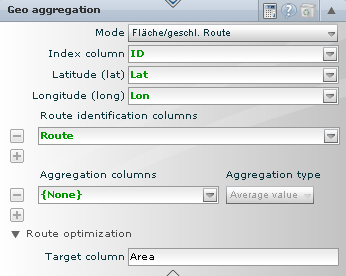
Next, create the "Geo Aggregation" operator and calculate the area by selecting "Area" as the mode.
Now switch to the MashZone Composer and create a table for filtering the area and visualizing the Google Maps map, as we did in the previous example.
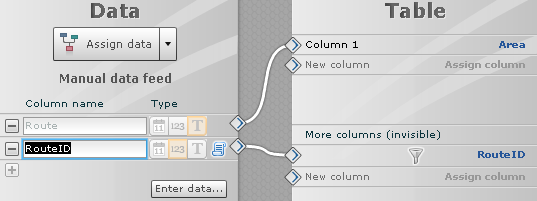
Fill the table with manual data. With the "Route" column the name is assigned to the area and the RouteID (1,2,3) is connected with an invisible operator. This invisible operator is new and allows extended filtering.
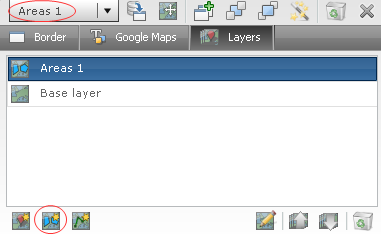
Now add a new "Area" layer to the Google Maps map and switch to the data assignment.
There, connect the "Area" column with "Polygon" that is responsible for the display of the areas. To filter the various places, "RouteID" is compared with the "Route" column from the Google Maps feed.
Here is the final example:

.png)


