
Today, I will show you how to insert a model graphic into your report. All models of the selected groups should be output as a graphic.
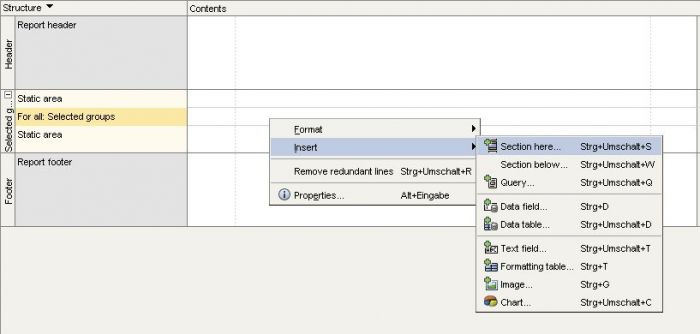
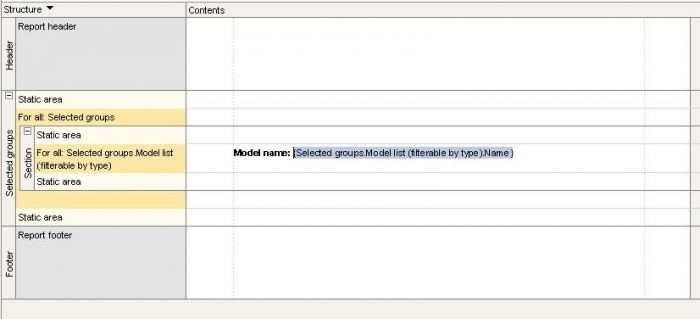
First of all, you must insert a new subsection in the repetition area.
Right-click in the repetition area of the subsection of the Selected groups query, and select Insert/Section here.
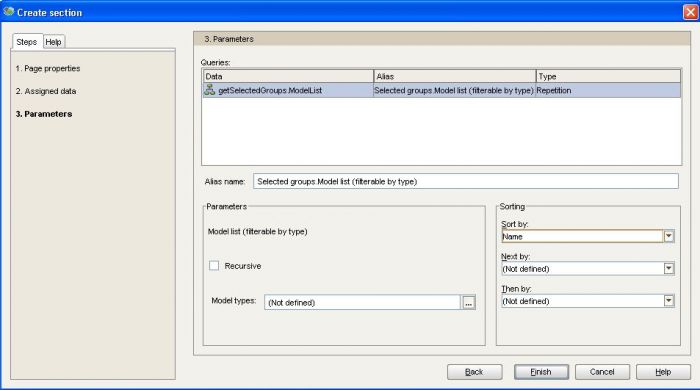
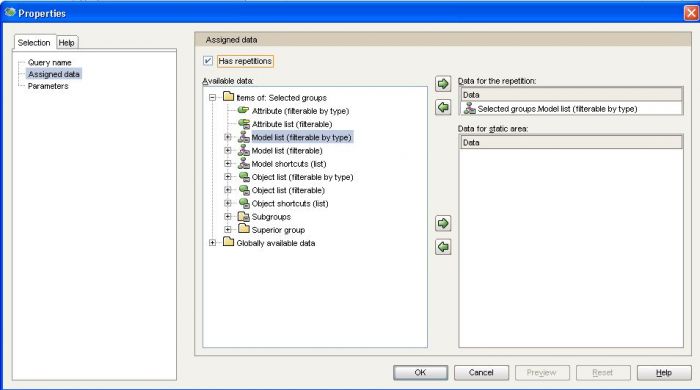
Click on Next and select the Model list (filterable by type) item under Items of: Selected groups and click on the Next button. Now you can select a model type (if you want to output only a special model) under Model types in the Parametergroup box. In our example, all model types are output. If you want to include subfolders, you must enable the Recursiveoption. Select Name in the Sort by selection box. Click on the Finish button.
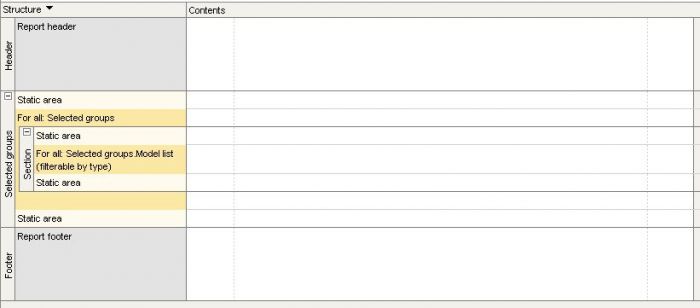
A subsection is inserted with a query for all models of the selected groups.
Now insert the model name as a heading. To do this, enter the text "Model name:" in the repetition area of the new subsection, then add a data field.
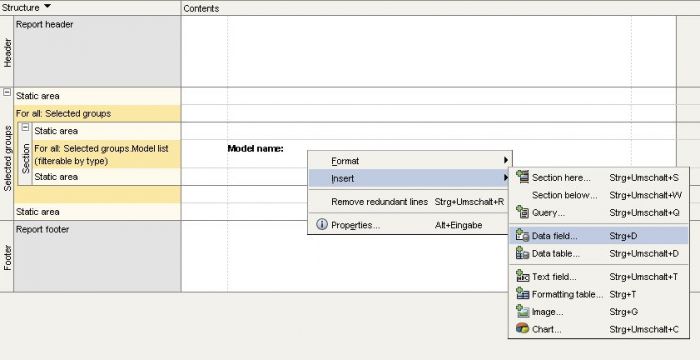
Select Name under Items of: Selected groups.Model list (filterable by type), then click on Next and Finish. A heading with the respective model name is inserted.
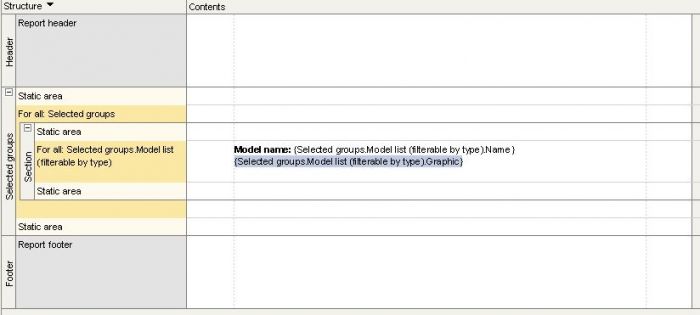
Insert a line break behind the heading, and then insert a data field with the Graphic element under the heading.
.jpg)
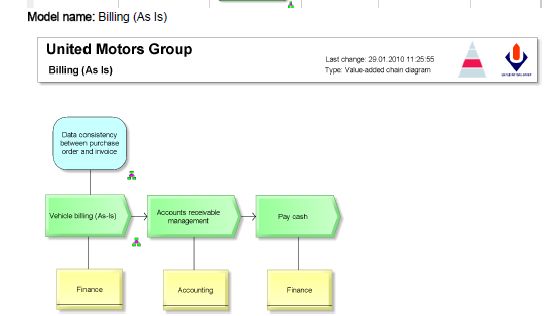
Now your report outputs all model graphics of your selected groups.
The output of the report may look like this:
Make sure to head over to the table of contents for my sequel on reporting with ARIS using the WYSIWYG editor.


Scott Wilson on
Eva
I am following your tutorials and there seems to be a problem with one of the graphics in this one. It comes after the line "Insert a line break behind the heading, and then insert a data field with the Graphic element under the heading." I was wondering if this was just occuring with me or there is something wrong with the article. If it is me would it be possible to send me what is missing as I am creating a lwp for my self. Thank you for helping to make my life a lot easier.