Today, I want to say a few words about how you can improve the performance of your dashboards.
- Always select a performant data source, such as CSV.
- Data sources should include only the data columns that are really used.
Avoid using files containing more data than required, for example, an XLS file from someone who is using such a file for reporting. In most cases, these files include a lot of sheets, formatting information, and data columns that you don’t need for your dashboard.
Example:
If a file includes 75 columns from which you actually use only 10 for your entire dashboard, all 75 columns are loaded every single time.
I know that it is comfortable to take the file just as it is to create dashboards (I myself did it, too…), but creating a dashboard is easier if you first prepare the file by deleting all unnecessary information.
- Data feeds should filter at a very early stage (i.e., take columns out that are not relevant to the dashboard).
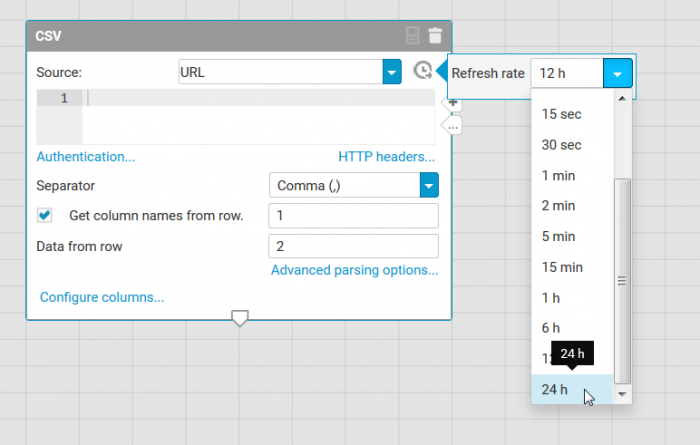
- Set data feeds to the highest possible cache time.
- Data sources that aren’t changed often, e.g., once a week, should have a refresh rate of 24 hours.

- In the Assign data dialog, remove all columns that are no longer needed for the widget.
Example:
If you have a pie chart and need only column1 and column2, remove the other columns in the Assign data dialog.

I hope to have provided you with some interesting information :).


Monika Leitner on
So true and your points a still valid for the new Dashboarding!
How the new dashboard for application portfolio management was implemented – Part 1: Introduction | ARIS BPM Community (ariscommunity.com)