Hi all!
I have a problem with the stacked bar charts.
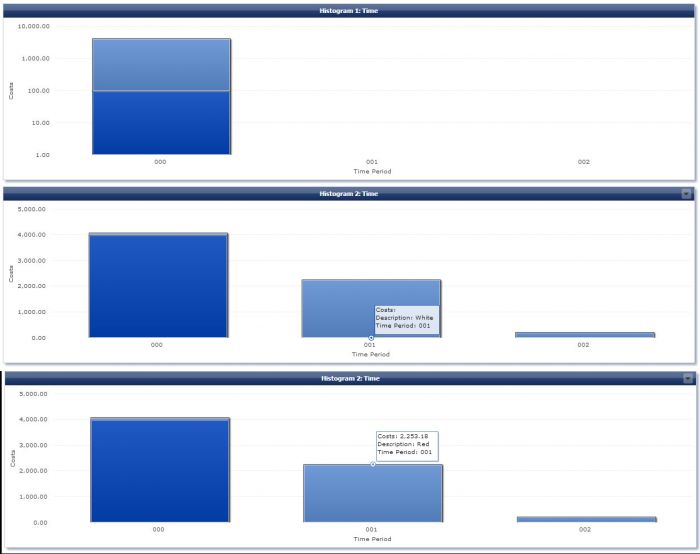
I have attached to this post a mzp file as an example, to show you the issues: there is a column chart with a table filled with demo data (Figure 1). Sometimes, some data categories are missing in the chart (like the first bar chart in the example - Figure 2); other times, the chart displays data that not exists in the datafeed (like the second bar chart in the example - Figure 2 - category White that not exists in the datafeed for the period 001 and 002, are shown though with no costs).
I miss something in my configuration or I was wrong or it is an issu
The demo data is (Figure 1):

The image below represents the issue (Figure 2):
Thanks a lot in advance
J Kirsch on
Hello Federico,
beginning with your second observation. Your data has gaps as you mentioned yourself. Value 'white' is not present for some combinations of the x-axis column and the stacked column. The chart requires to have 'datapoints' for all existing combinations. Therefore there are bars (with zero height) present in the chart. The tooltip says that there is no value for 'cost' which is correct in this case as there is no value present indeed in the base data.
To your second observation. This behaviour is actually based on the same circumstances as your observation above. The first value that is visible in the bar chart for the stacked dimension (Description) is a value that occurs only once (red) and is missing in all following rows. The chart implementation is unable to render the sparse data set correctly. When you change the sort order for the stacked dimension to 'descending' it will begin with 'white' and display all values properly. We have picked this up as a bug.
Regards
Jürgen