Such a topic could easily attract philosophical speculations. However, the intention here is to make a short and pragmatic walk within the territory that's common for this community. And I hope it will kick off some fruitful discussion.
Models in time
Let's review the all too familiar transformational tenet "AS-IS/TO-BE" with three aspects: reality, models and time. It will again be a model, inevitably a wrong one but hopefully a bit useful.
The release time T2 of a model of an existing object is normally equal or bigger compared to T1 - the modelled object's state time. Then based on that we normally[1] make several "COULD-BE" models. These are options related to future time Tn, created in T3 and T4 (see attached ADF - “time of the model”/”time of the real object state modelled”.) Of course the real object in T4 is probably different from how it looked in T1. It's good to have this in mind and do reality check from time to time to be sure that the projections are based on the right assumptions. Once confirmed that all COULD-BEs are based on solid grounds and look like viable options, they could be compared and tested through what-if exercises and simulations. Then we choose a "TO-BE" winner or make one combining the non-excluding strengths of the nominated COULD-BEs.
When this TO-BE (T4/Tn) is implemented, sometimes in stages, we have a real object in state Tn which is a transformation of the one from T1. If we model it, chances are the new AS-IS (Tn+1/Tn) will not look much like the TO-BE (T4/Tn).
Now let's see some examples of modelling time in ARIS.
Time-dependant look and position
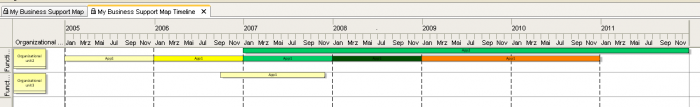
One nice way to represent time is by changing the shape and position of on object symbol depending on time attributes. That's achieved in ARIS with attribute based modelling where an object occurrence take its place in the model based on some attribute representing point in time and the shape is changed to represent another, typically some kind of duration.
Clogged processes
ARIS Business Simulator can do wonders with simulating process behaviour based on many time attributes like processing, orientation and static wait time. One of the many benefits however is finding the process bottle necks, those places where the flow gets clogged. And the miracle KPI showing this is the dynamic wait time. It accounts for many things like resource availability, capacity, how the job is done and when.
Lost Time
Lean manufacturing focuses on eliminating various types of waste like transportation, waiting, overproduction, inventory and complexity. But then again it all comes down to lost time (and eventually money). The Value Stream Mapping, a proven technique, represents waste by turning overproduction or late production into times depending on customer demand. These times sum up to the process lead time (PLT). The time of value-added activities divided by PLT shows the process efficiency. We can test how different improvements like pulling and levelling can change that.
It's time to find the real cost
Processing time along with how many times a resource is used can show where the real overhead is compared to traditional costing methods. The process cost analysis in ARIS Business Optimiser calculates instantly the complex interrelation between structures and KPIs.
Many timelines together
We can imagine two, three dimensions and some of us probably a bit more. But that's all. The Process Support Map in ARIS IT Architect overcomes this modelling challenge by showing together timeline of many application systems in relation to the time of their support of particular process and in particular location.
Time recording
That’s probably more logical to start with than to end but anyway. Time recording recently appeared in Business Optimiser.
[1]The approach do first AS-IS then TO-BE is often criticized and sometimes rightfully. The intention here is not to promote it or discuss it. That could be a topic of another article.