
Hello,
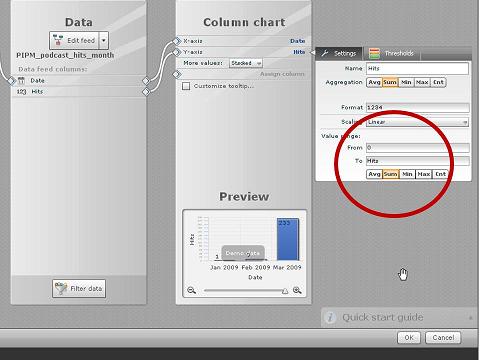
I am having issue with a MashUp of mine, specifically with a column chart. Currently i have been running the MashUp for bout two months and it contains a column chart that tracks hits per month. So I have a column chart with dimension values "October" and "November" and corresponding number of hits.
I've originally configured the value range to use the "Sum" operator and that worked fine for the first month. The value range kept adjusting to the value of October, however once the values for November were higher than for October the October values disappeared, I believe due to the fact that the value exceeded the value range. It appears that the sum operator only takes the first dimension value into account.
Looks to me like there are two things that ought to be corrected: The sum operator for value range should always account for the largest dimension value and if a value exceeds the value range it should generally still be displayed.
Not sure if i am missing something in the config but it looks to me like I'm off to adjusting the value range manually.
.
J Kirsch on
Hi Phil,
you are right with both of your assumptions. Currently only the first value is used to determine the boundaries of the displayed chart value range. This will be fixed for the release of MashZone. Also the value that exceeds the upper boundary is not displayed because of exactly this reason. This is not an error per se and will therefore not be fixed.
Kind regards,
Juergen