

Hello ARIS Community,
Ever wondered which of your business processes are truly being utilized and which ones are gathering dust?
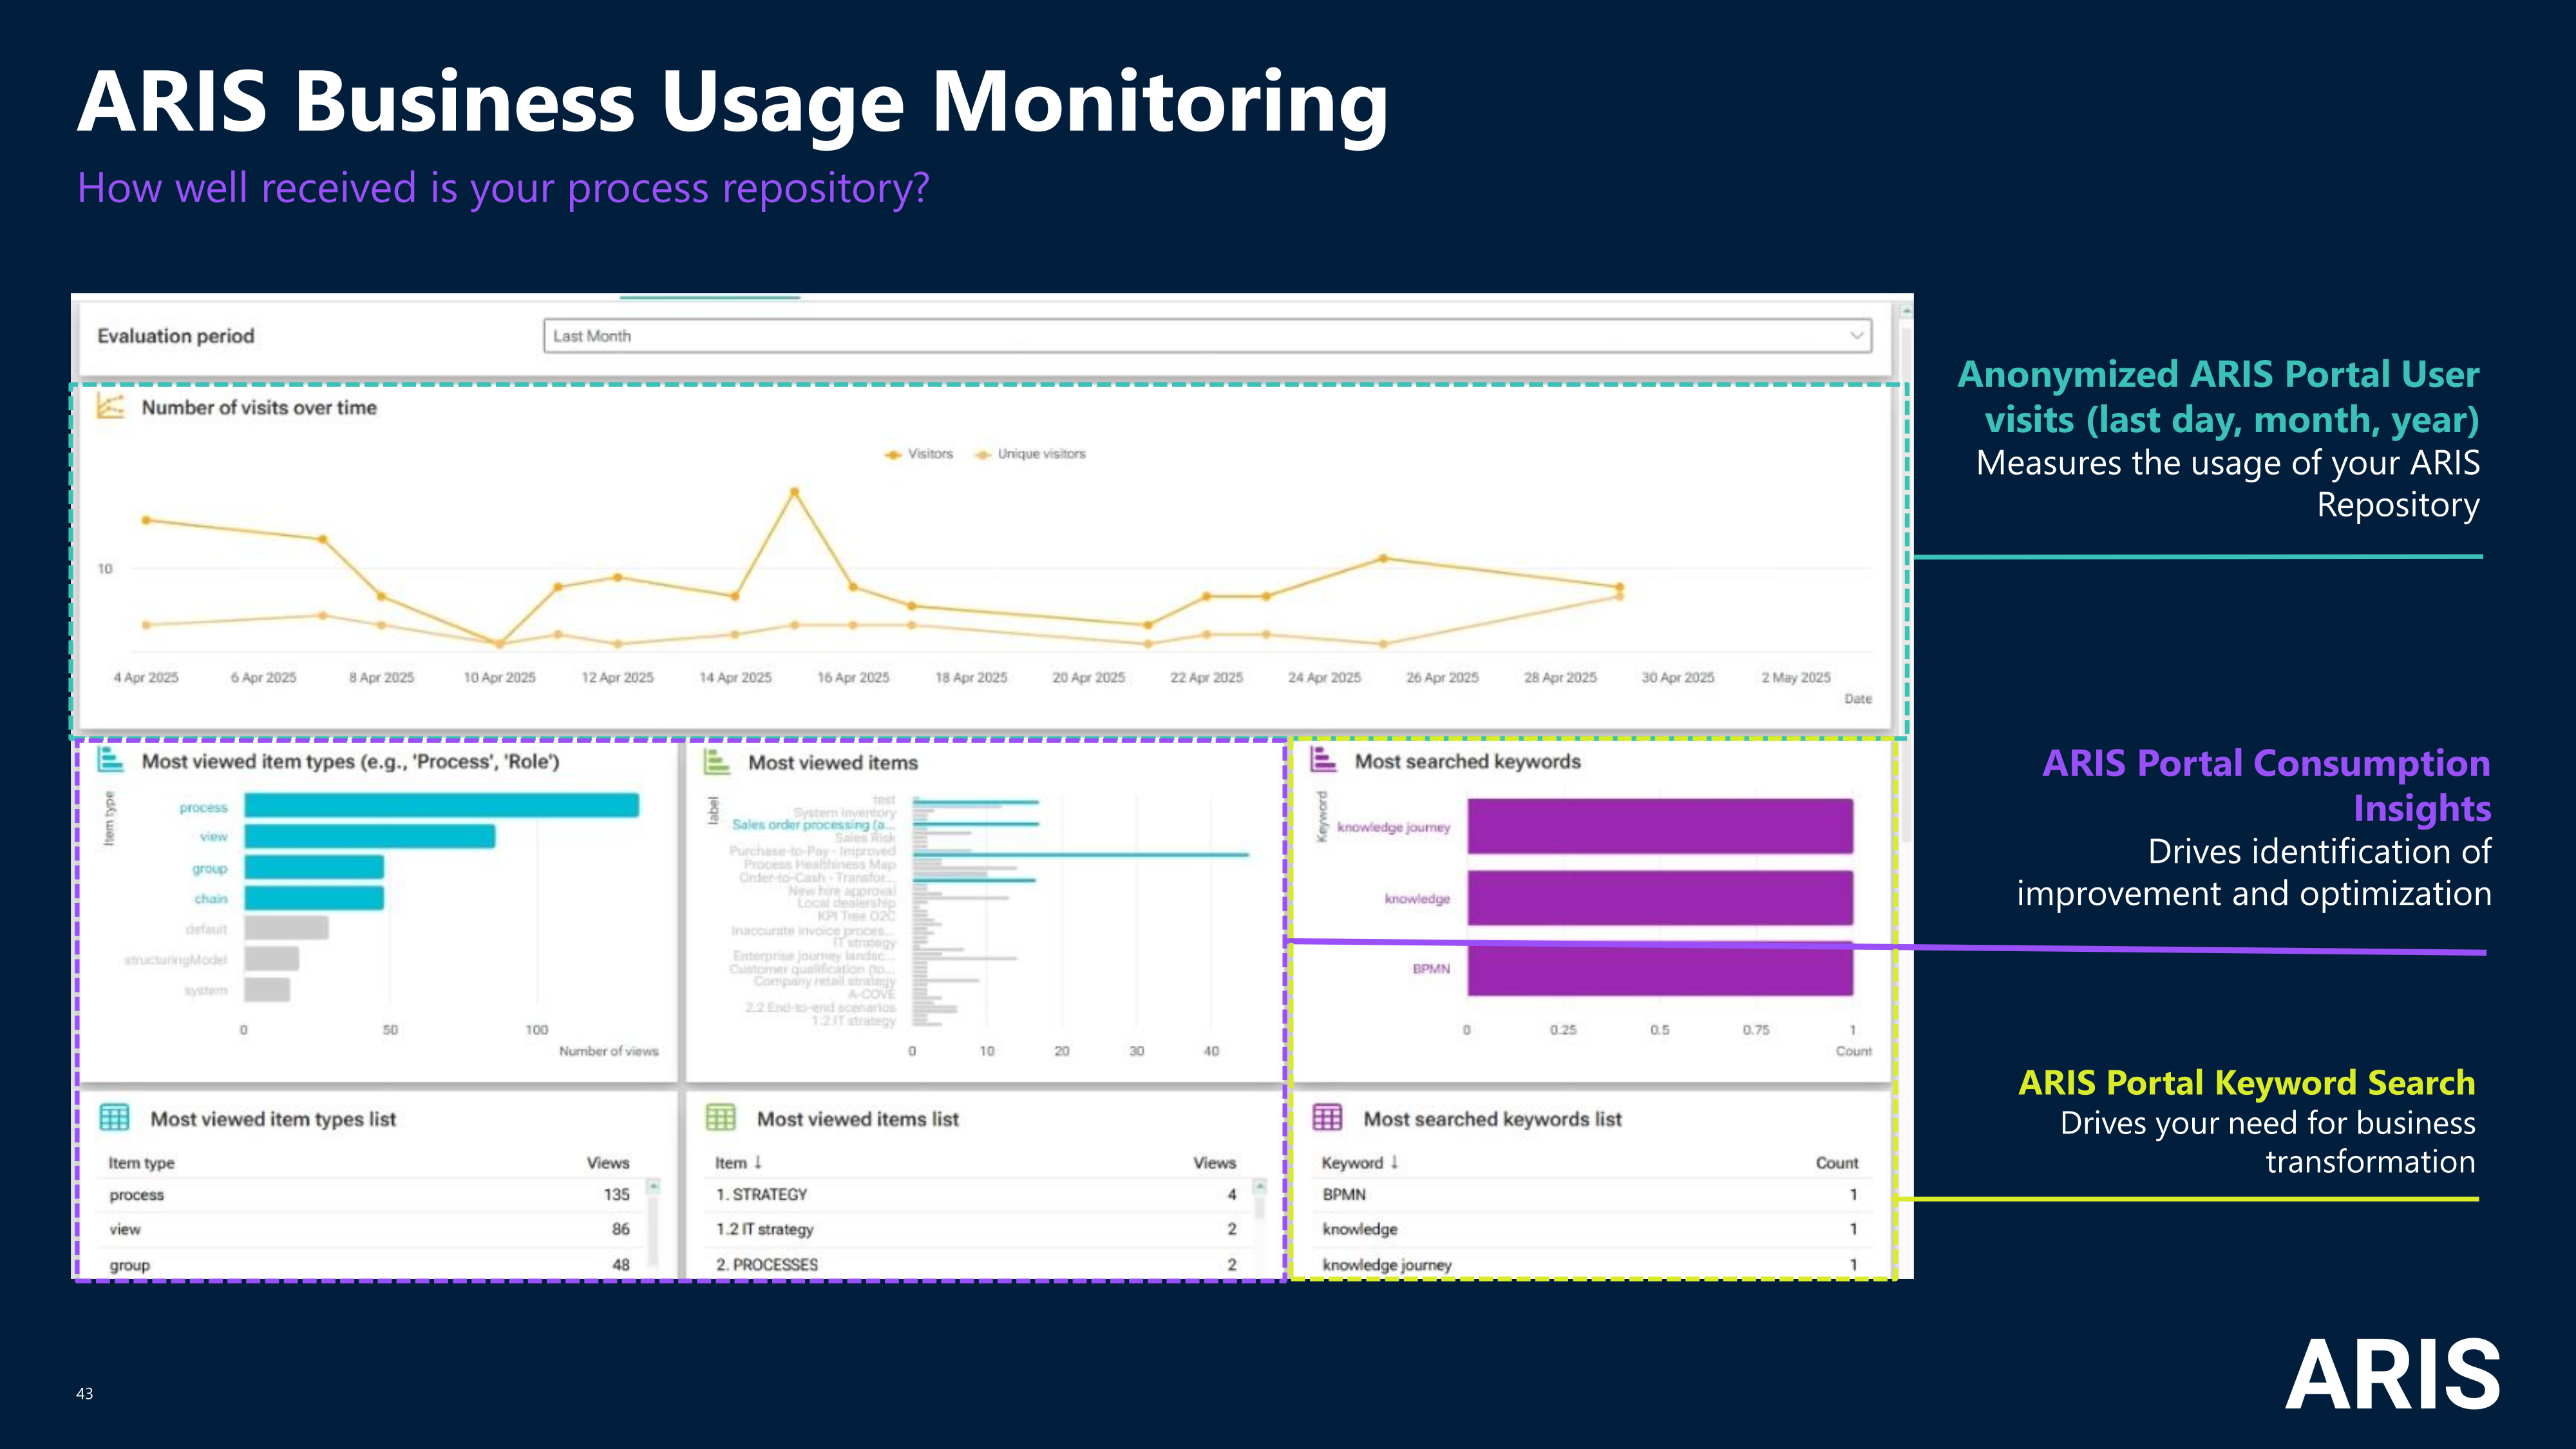
Curious about the most searched keywords and whether your repository is meeting those needs?
Do questions about content gaps and process optimization keep you up at night? With ARIS Matomo clickstream analysis you gain invaluable insights into user interactions.
This data-driven approach helps you understand which models (processes, organizational charts, risks, etc), objects are consumed, identify areas for improvement, and pinpoint the most sought-after content.
By leveraging these insights, you can optimize the usage of the ARIS repository, enhance content completeness, and ensure that your business processes are aligned with user needs. Dive into the world of clickstream analysis and transform your ARIS experience!
Business Usage (Matomo) Dashboards
For monitoring and analysing your (anonymized) user behaviour two dashboards have been implemented and published to support our common use case pattern insight (on user behaviour) to action (improvement of maturity of repository).
- Publication (Matomo) - Business Usage Statistics
- Technical KPIs (Matomo) - Technical Usage Statistic
The first dashboard "Publication (Matomo)" provides a comprehensive overview of how your ARIS content is being utilized. It features various charts that allow you to evaluate different aspects over selectable periods, such as the last week, last month, and last year based on your publicated ARIS databases.
Use these insights to optimize your ARIS repository, enhance content completeness, and align business processes with user needs.
Start leveraging the ARIS Business Usage Dashboard today!
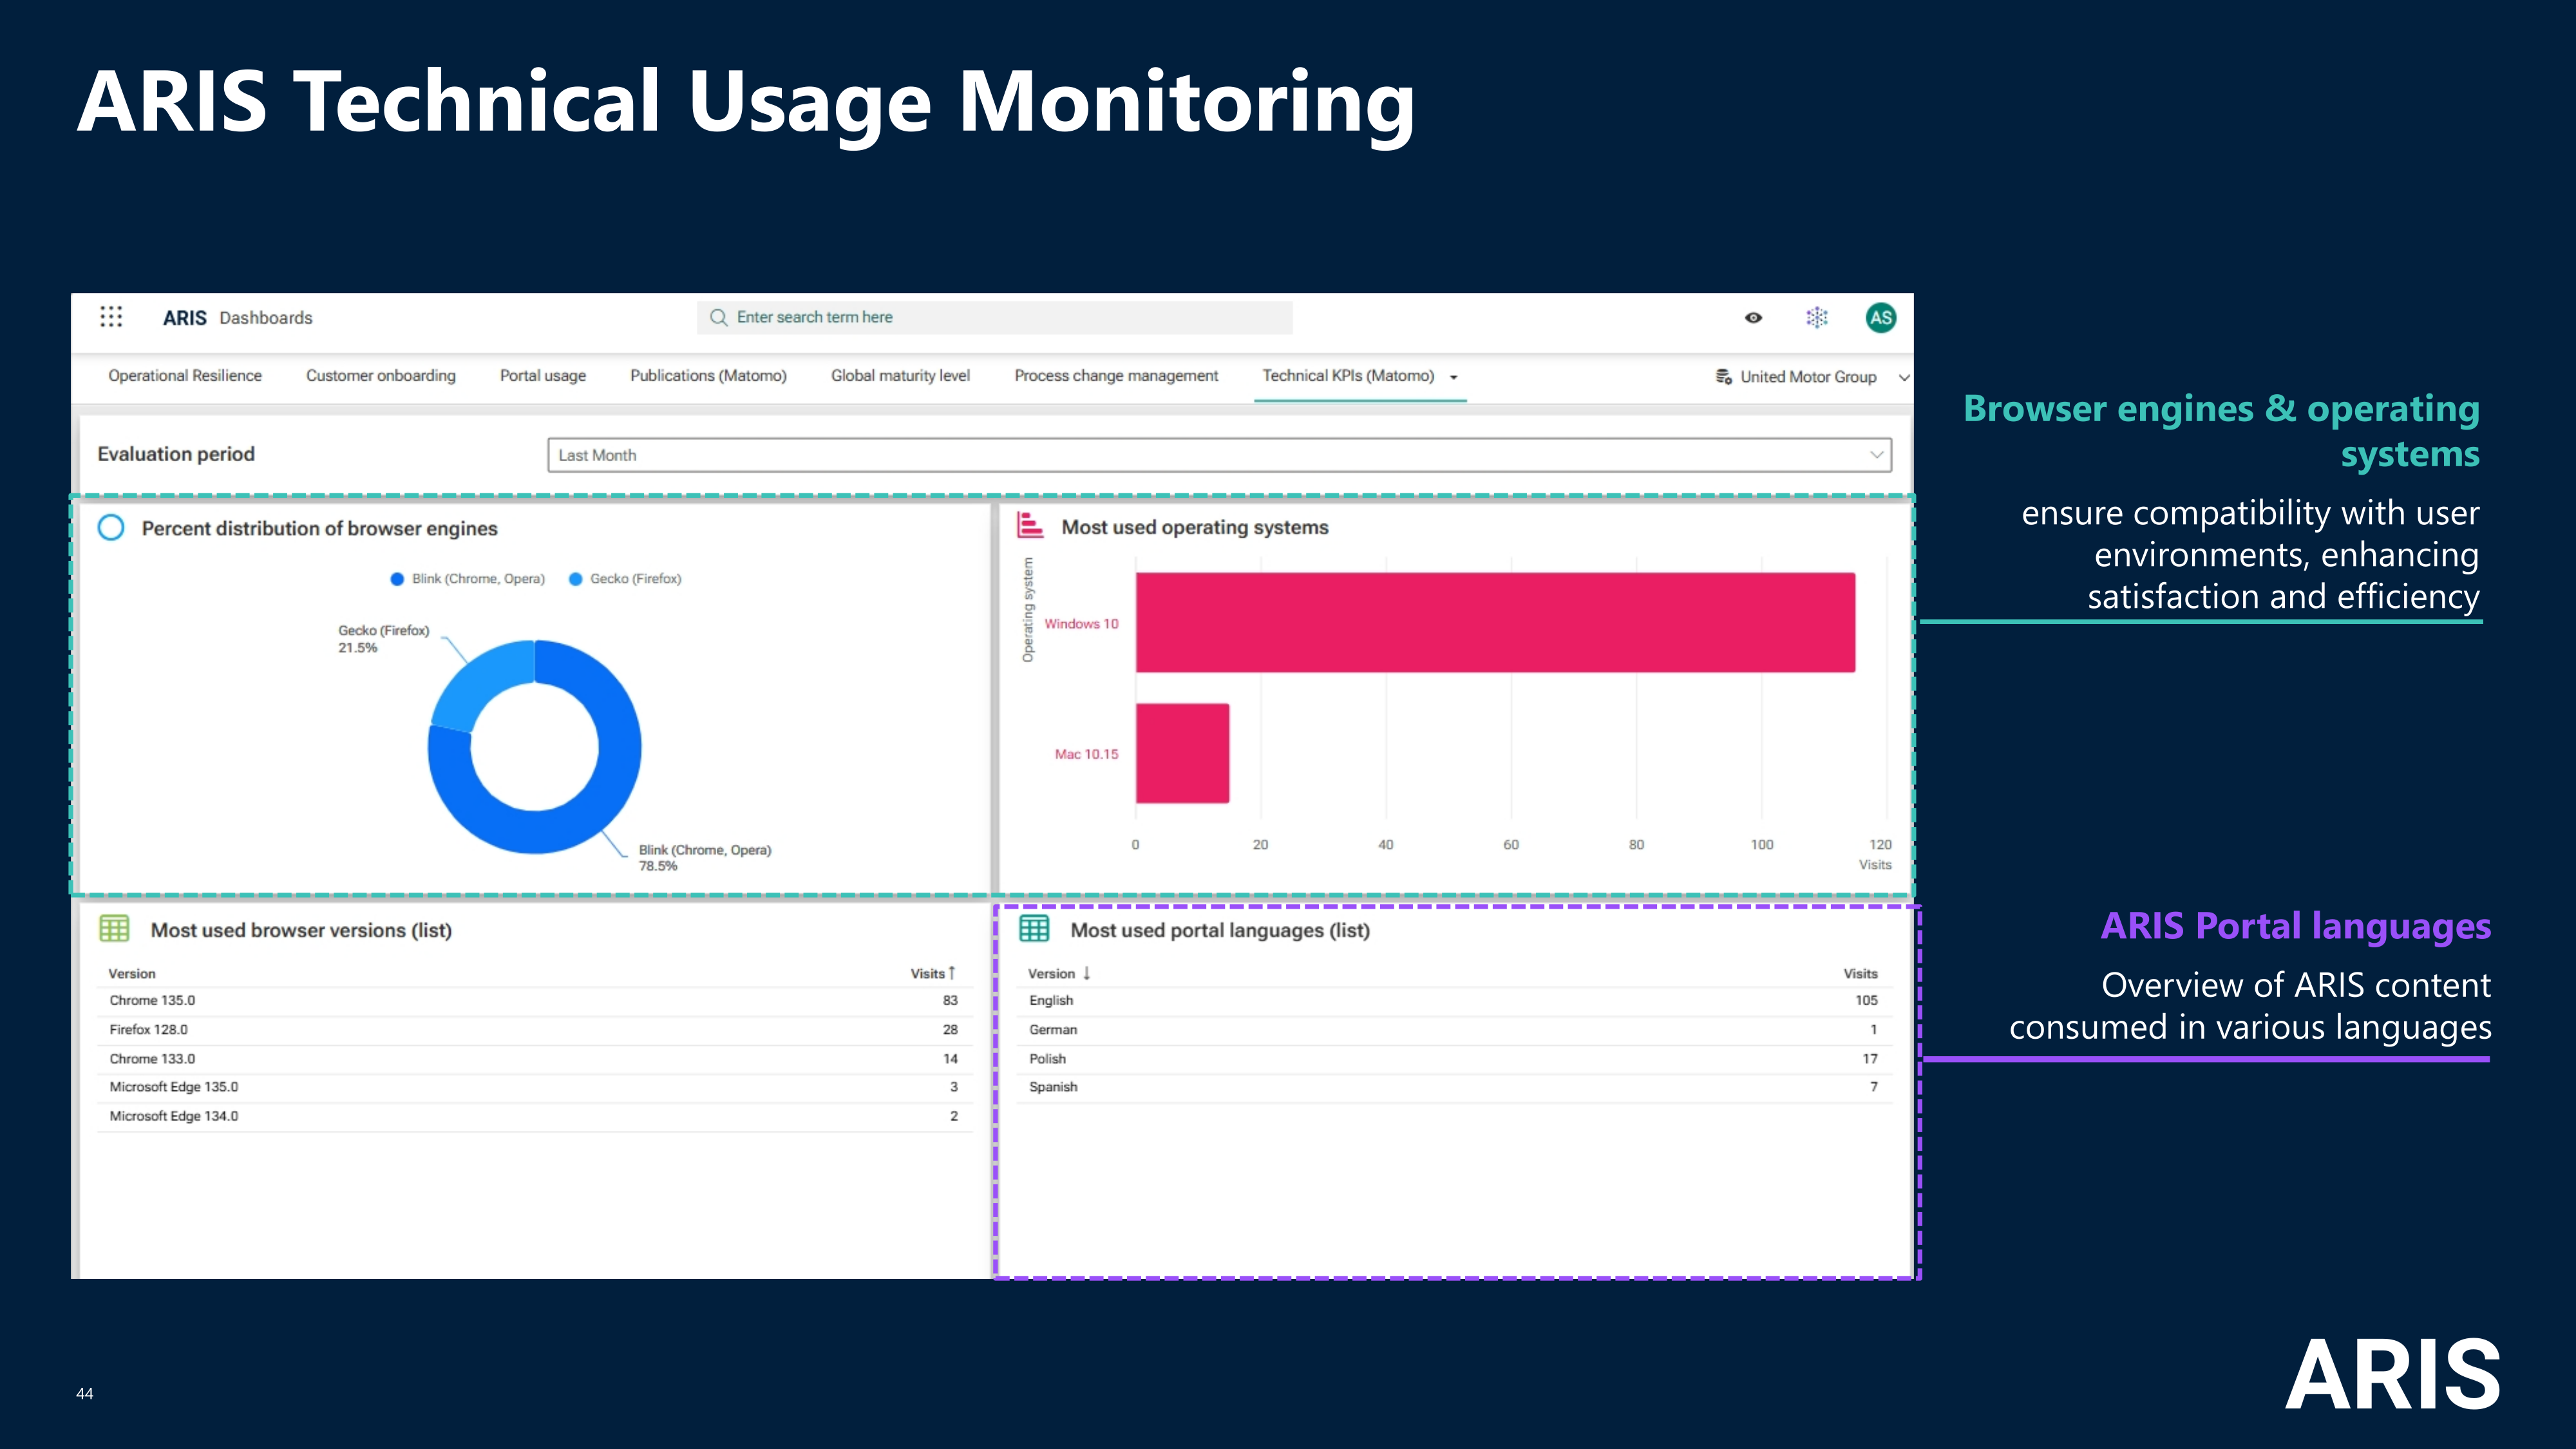
The second dashboard “Technical KPIs (Matomo)” - is essential for optimizing your portal's performance.
It provides insights into browser engine distribution, most used operating systems, browser versions and most used portal languages over selectable periods, such as the last week, last month, and last year based on your publicated ARIS databases.
These metrics help ensure compatibility with user environments, enhancing satisfaction and efficiency.
Data preparation
After setting up the ARIS – Matomo configuration the data for these dashboards is created
- context sensitive
- per ARIS database
- per item types (process, chain, groups etc)
- several model attributes
- fetched via predefined, scheduled ARIS Reports (Matomo - Global portal usage, Matomo - Database-specific portal usage)
- uploaded to the ARIS Document Storage server
- ARIS document storage|Dashboarding|<ARIS database_name>|Matomo) and
- ARIS document storage|Dashboarding|Matomo) as files to use for these dashboards.
This data can of course be leveraged with other existing data in your data ecosystem (inside and outside of ARIS) to tailor this standard use case to your needs.
Most common customer specific adaptions
| Use Case | Report Change | Datafeed Change | Dashboard Change |
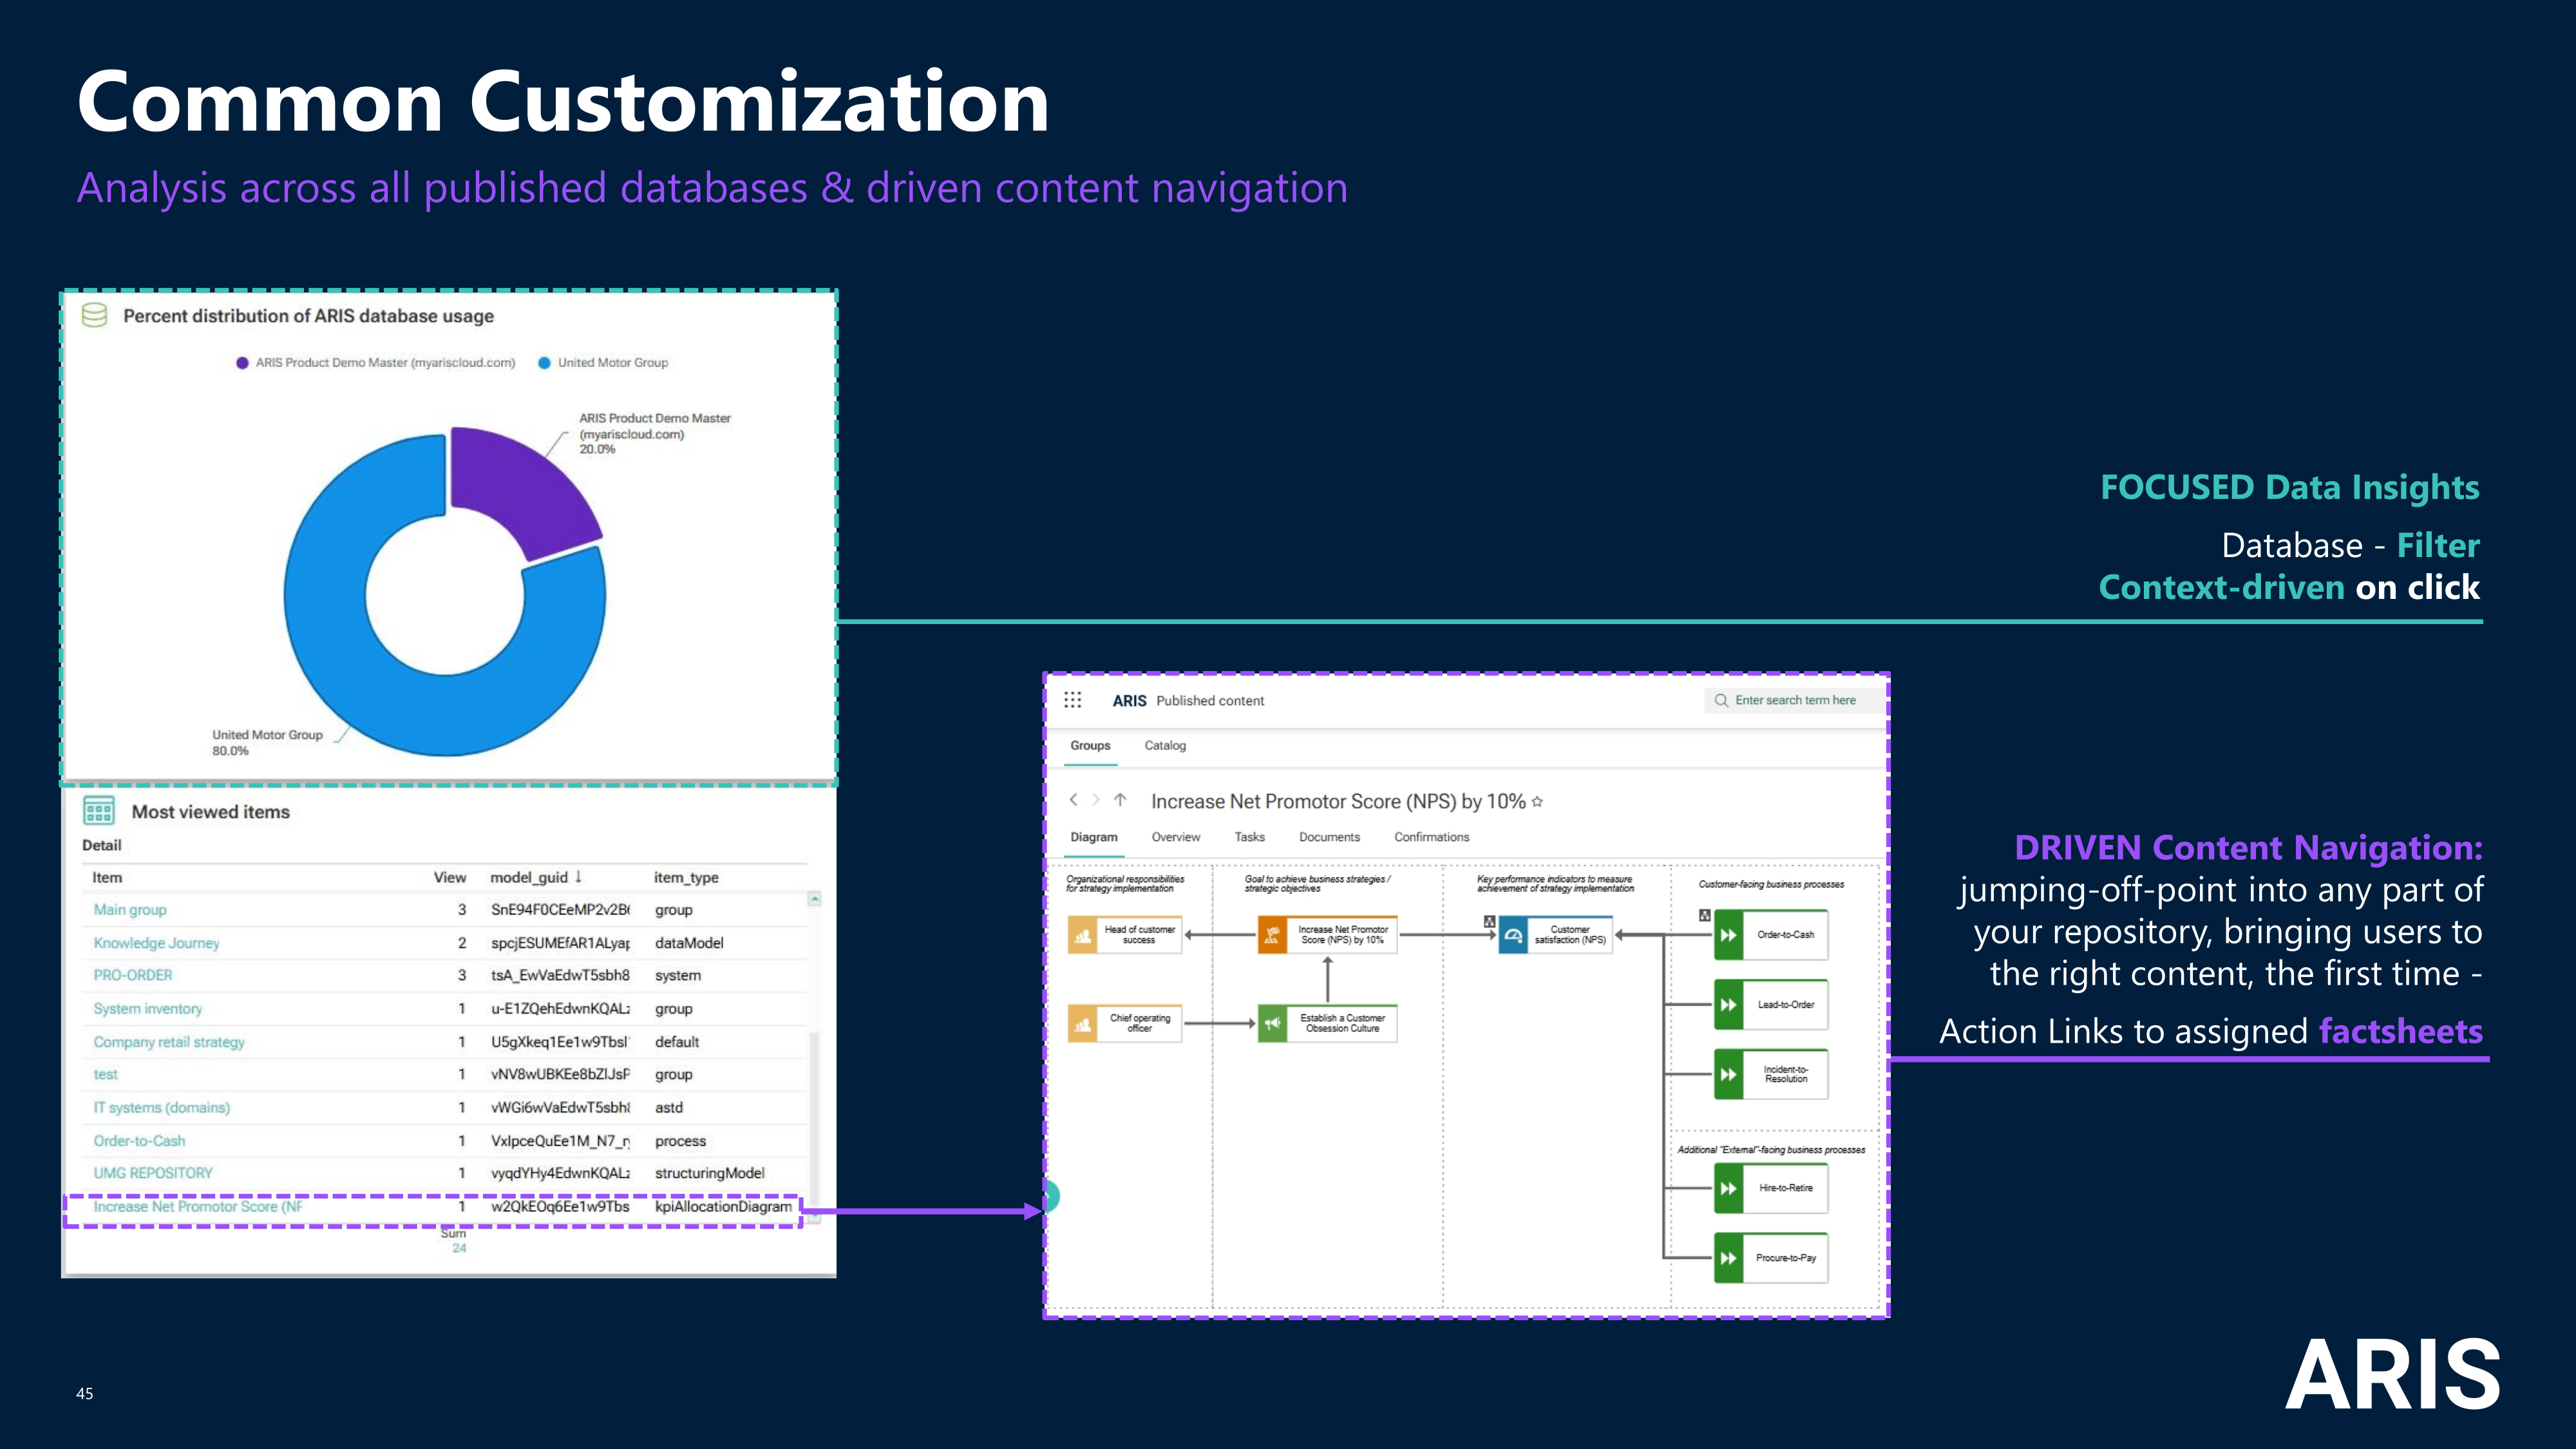
| Business Usage Dashboards across all publicated ARIS database | X (include databasename) | Change to customer needs (define filter criterias) | |
| Navigation from Business usage statistic to factsheet | X (include GUID of object, model) | Define navigation actions | |
| Performance Tuning | X ( IChange Report Output from XML to relational database if file limit exceeds 80 MB) | X New Datafeed (Define user inputs for SQL filter parameters) | Adapt user filters to limit or aggregate to support performance tuning |
Please find the documentation for configuring ARIS and Matomo, on-premise and SaaS, at docs.aris.com. This resource includes guides on setting up and scheduling ARIS reports for data preparation, along with answers to questions about data tracking, anonymization and pseudonymization, GDPR compliance, and data ownership. Take your time to explore!
That's a wrap for today's tech talk on ARIS dashboarding!
With ARIS moving into the cloud and the availability of using a Matomo subscription (with ARIS 10 SR24), including a free 21-day trial of Matomo, the integration process has become much easier. It can be set up and tested within minutes, allowing you to quickly start benefiting from these powerful insights. Dive into the world of clickstream analysis and transform your ARIS experience!
Our dashboard blog topics:
- Standard use cases and how to adjust them to your needs
- Guidelines on how to build your very own dashboard use cases from your business questions, including hints on data visualization techniques and guidelines how to design and optimize data feeds
- Blogs regarding your shared customer use cases
Here is the deal: You provide the question and sufficient detail, so that we can provide meaningful advice. In exchange we will provide the desired information via a blog post.
Monika (20+years experience in BI/Mining/Transformation) & Helmut (Dashboarding developer since 2009)
P.S.
- Access to free self-paced training ARIS Dashboard Basic
- ARIS documentation has moved to docs.aris.com
P.P.S. We are thrilled with the feedback we've received so far and are eager to hear more about how you're using ARIS dashboards! Feel free to share your use cases or use case related questions in either English or German. Your insights are invaluable to us!
Monika Leitner Author on
I was asked how to define an acttion based navigation - meaning a link from a dashboard to the respective underlying model or object
This works with the following 4 steps.
in my case it was the modelguid of the grid widget with the ID matomo
In my case the column item
You have to define an action with a trigger for that widget
In my case - define the trigger = on cell click (item) -> the gable I have enabled as clickable before
You have to add your link - for model or object factsheet you want to navigate - the easiest way to do that is to navigate to the factsheet in the portal - copy that link and exchange parts of it with paramaters
https://XXX.ariscloud.com/#XYZ/item/c.process.United%20Motor%20Group.484XGcedEew7jQoAJwAABA.-1
<SERVERURL> /<tenantname>/item/c.<item_type>.<database_name>.<model or object GUID>.-1
--> make that relative and exchange Database, tenant with ARIS Parameters, and fetch the GUID from the widget
See my configuration of the action to navigate to a factsheet of a model in the screenshots below
Hope that helps
Best
Monika