

In today's fast-paced business environment, understanding and optimizing business processes is not just a necessity; it's a game changer. ARIS, stands at the forefront of this revolution. In this post, we'll demonstrate how ARIS Process Mining will help you to simulate your processes.
I want to cover three different products in this article ARIS Process Mining, the ARIS process simulation as well as ARIS BPA to generate and maintain the process models. I will start in ARIS Process Mining where the models can be generated using the mining to model capability. We will have a look at a dashboard that allows to generate simulation attributes on the example of throughput times. This allows us to on one hand find appropriate values to drive dissimulation, but on the other hand to compare all results with each other and validate a certain change that we want to implement.
But before we start let’s have a look at the demo that we will use. It is a fairly simple order-to-cash process that includes several steps beginning from the automated or manual order intake, the creation of the sales order in an SAP system, several communication and packaging processes and, afterwards the creation of the invoices and a dunning process.
In ARIS, these measures can be used to create realistic models that reflect actual business operations. By incorporating real data on process duration, frequency, and resource allocation, simulations become more than just theoretical models; they become a reflection of the real business world, allowing for more accurate predictions and planning.
Part 1: Measuring Processes in ARIS Process Mining
As we currently do not have a process model available, we can create one based on the variants that we have discovered using process mining. Using the mining to model capability we can generate a BPMN 2.0 collaboration diagram.

Description automatically generated" width="602" height="338">
This will then result in this BPMN model (which I slightly adapted to better fit this screen).

Description automatically generated" width="602" height="235">
To enrich this model with attributes for the simulation we need at least to cover 2 aspects:
- The throughput times of the tasks and
- the split distributions.
Both aspects can simply be generated using ARIS Process Mining. Therefore, I created 2 app builder dashboards in ARIS Process Mining. One for the measurement of the activities

Description automatically generated" width="602" height="301">
and another one for the measurement of the connections.

Description automatically generated" width="602" height="301">
There you can see all the important measures that we can reuse for the ARIS Simulation. In the case of this example, I want to use a triangular distribution to describe the troupe time of the activities. To create a triangular distribution, you need the following three parameters:
Minimum Value (a): This is the smallest value in the distribution and forms one corner of the triangle.
Maximum Value (b): This is the largest value in the distribution and forms another corner of the triangle.
Mode (c): This is the value that occurs most frequently. In the graphical representation of the triangular distribution, this is the peak or the topmost point of the triangle. It must be a value between the minimum and maximum values. To simplify this, we will use the mean or average to estimate the c value.
The triangular distribution is a simple probability distribution that is graphically represented as a triangle, where the probability density is zero at the minimum and maximum values and increases linearly to the mode. This distribution is often used in simulations and as a subjective description of a population for which the minimum, maximum, and mode are known or can be estimated.
Part 2: Using Measures in Process Mining to Prepare a Process Simulation in ARIS
The measures obtained from those process mining projects serve as the foundation for preparing accurate process simulations. In ARIS, these measures can be used to create realistic models that reflect actual business operations. They become a reflection of the real business world, allowing for more accurate predictions and planning.
Let’s do this now on the example of the first 2 activities in ARIS Process Mining that will be represented by 2 tasks in the BPMN 2.0 model. The procedure is the same for all the other attributes.
Let's get now to the value for the 2 activities:
Create iDOC with a = 9 s, b = 1 min, c = 34.46 s

Perform Manual Order Intake with a = 1 min, b = 5 min, c = 3 min
Description automatically generated" width="466" height="277">
The attributes that we see in the table above can be represented in ARIS using special simulation attributes. One of those attributes is the processing time.
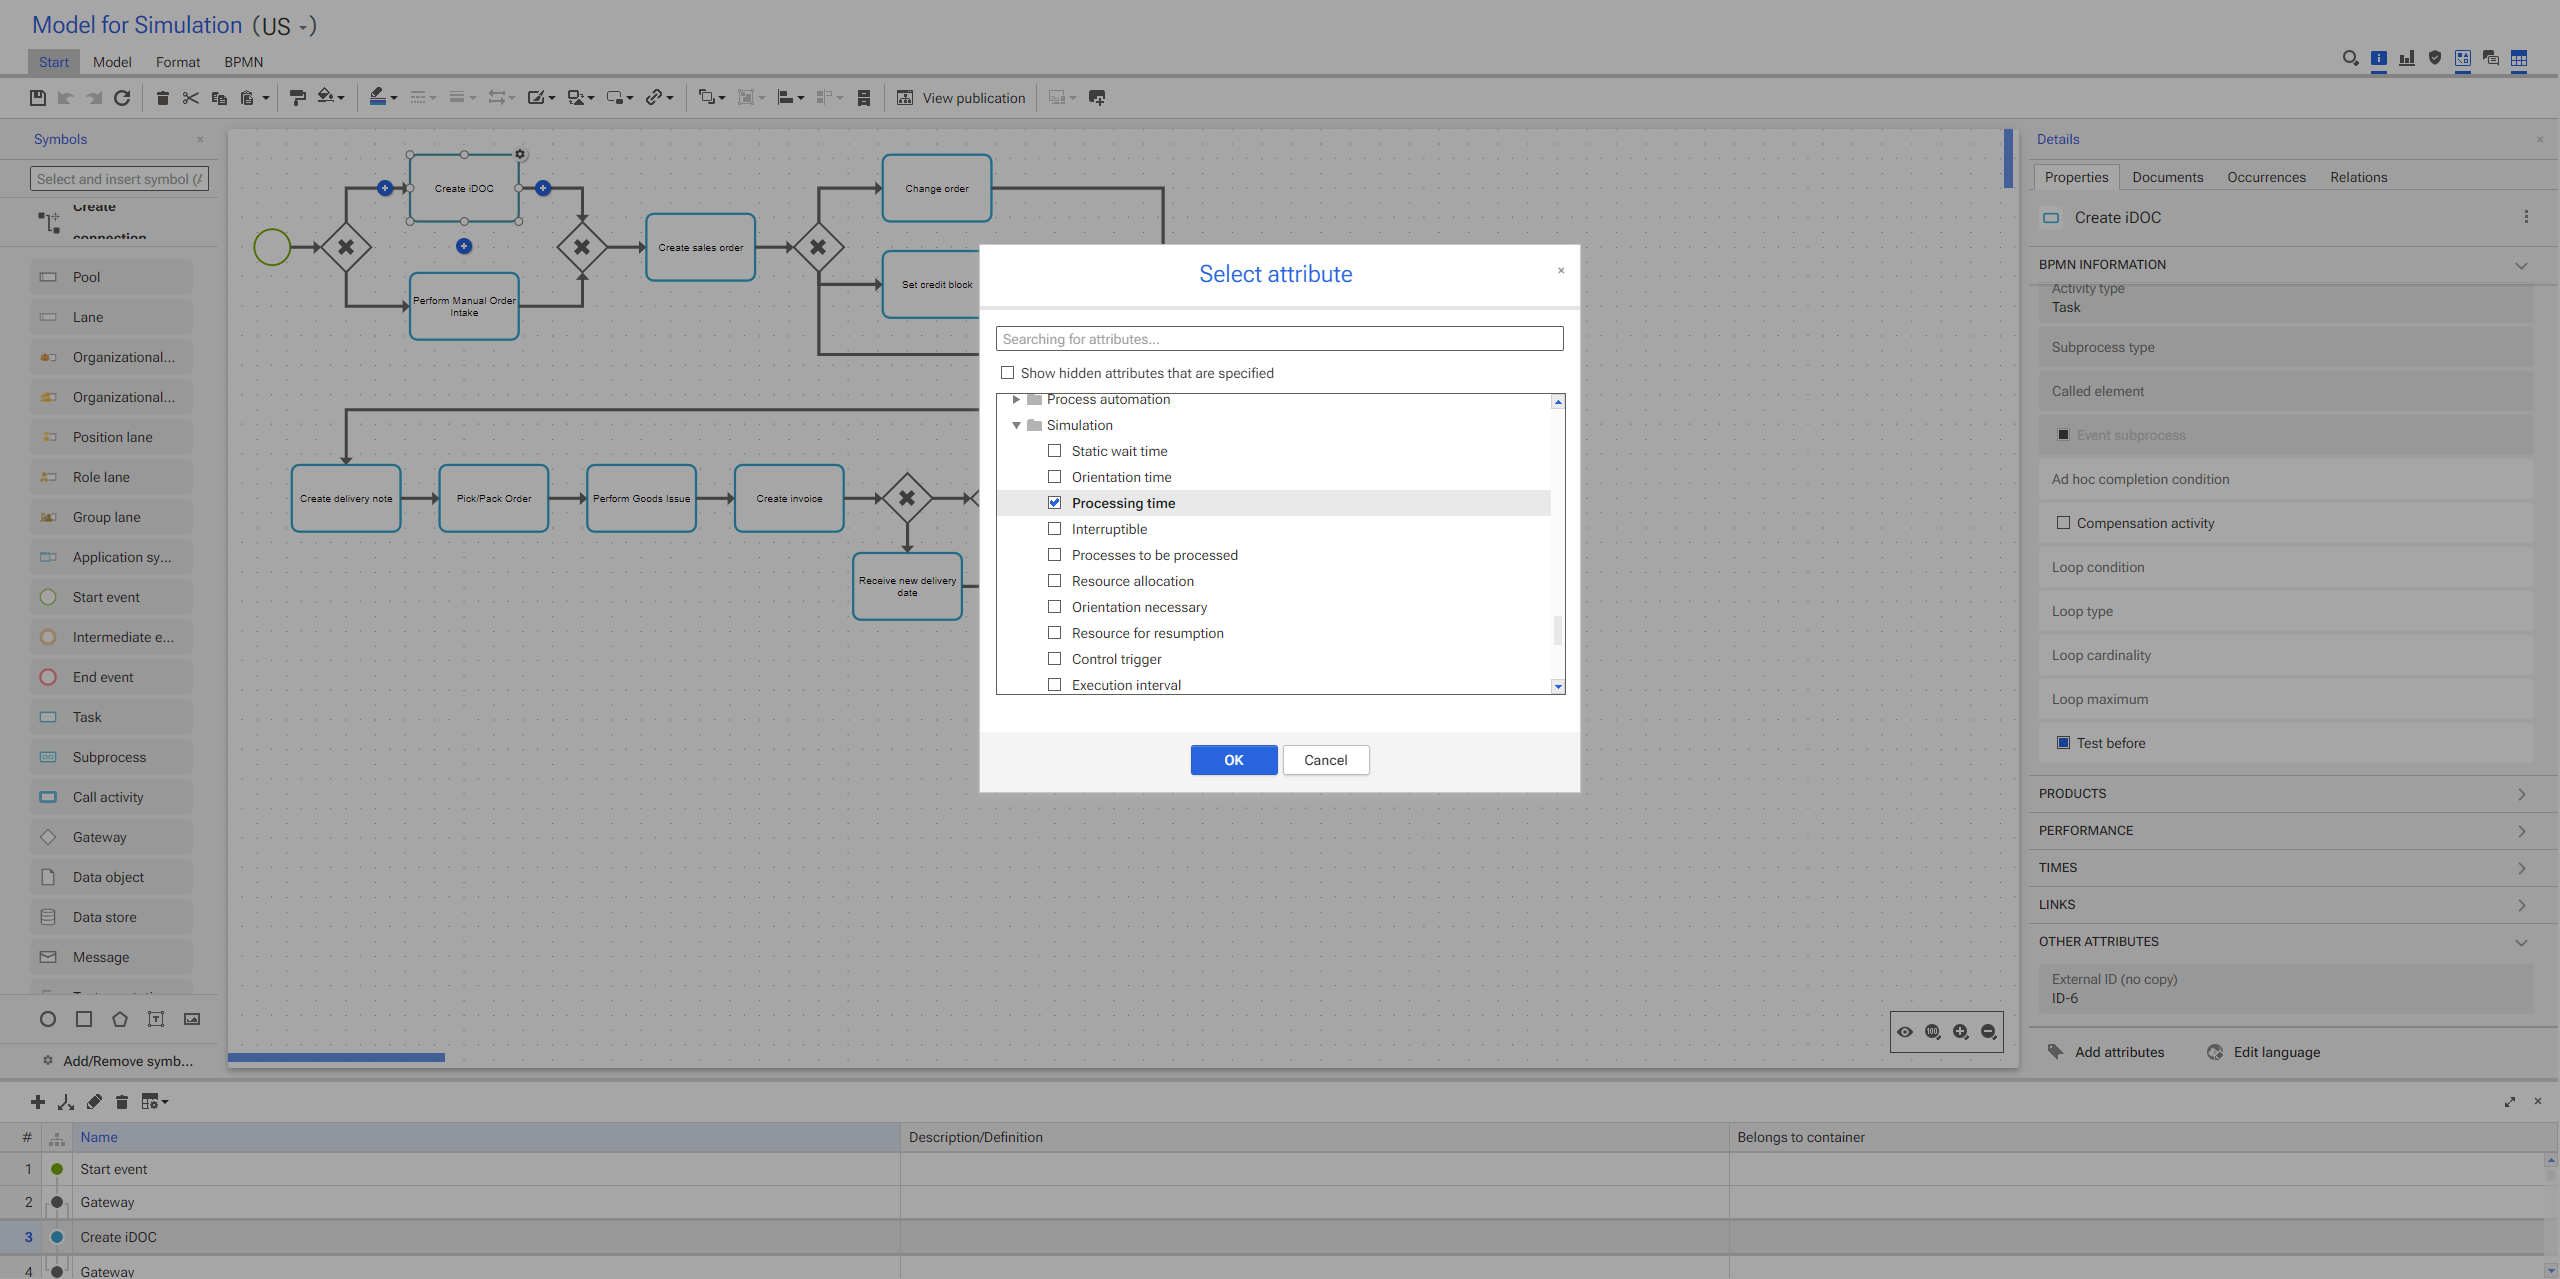
Description automatically generated" width="602" height="301">
It we have now enabled this attribute, we can simply maintain and see this attribute. The value in the attribute is the distribution, that can simply be selected, and the values for a,b and c.
Triangular distribution (a=0000:00:00:00, b=0000:00:00:00, c=0000:00:00:00)
If you remember the values from process mining, we can find those here again. Let’s have a look at how they look as ARIS Simulation attributes.
Create iDOC with a = 9 s, b = 1 min, c = 34.46 s ->
Triangular distribution (a=0000:00:00:09, b=0000:00:01:00, c=0000:00:00:34)

Perform Manual Order Intake with a = 1 min, b = 5 min, c = 3 min ->
Triangular distribution (a=0000:00:01:00, b=0000:00:05:00, c=0000:00:00:03)
The same works for the gateways and their probabilities. Let’s have a look at how this would work for the gateway after Create sales order. We see in the Connection Measurement Dashboard that we already have all the needed values:
Probability = (Number of occurrences of that connection) / (Number of all connections that leave this activity)Create sales order -> Change order with a probability of 1.230 / 7.245 = 0,1697 ~17%
Create sales order -> Create delivery note with a probability of 5160 / 7.245 = 0,7122 ~ 71,2%
Create sales order -> set credit block with a probability of 855 / 7.245 = 0,1180 ~11,8%
If we look then at the process model and the modelling table in ARIS this looks like the image below with all attributes already transferred.
Part 3: Run the Simulation
We can then use all attributes to simulate the process. But before we can run the simulation we need to specify the timeframe as well as the warm-up time for the simulation to prepare the engine and the tokens. I will run the simulation now for 1 year with 2 months of preparation time.

Description automatically generated" width="602" height="329">
We can then use the simulation log in ARIS Process Mining to analyze the simulation outcome in ARIS Process Mining.
We have now simulated the process. In part 2 of this series, I want to show how you can use ARIS Process Mining again to analyze the outcome of the ARIS Simulation. The dashboards that I have built in ARIS Process Mining can be downloaded at the bottom of this article. In addition, we are going to release an accelerator for ARIS Process Mining that will help you in finding the right attributes, setup your simulation or scenario experiment and then compare the processes and simulation runs with each other.

Monika Leitner on
Wow - a strong use case for existing ARIS customers ;)
Mine - simulate changes - analyze- optimize - roll out - and manage the impact -all in one platform.
Get your own ARIS Process Mining Basic instance for free
https://aris.com/try-aris-for-free/ import the project and see yourself