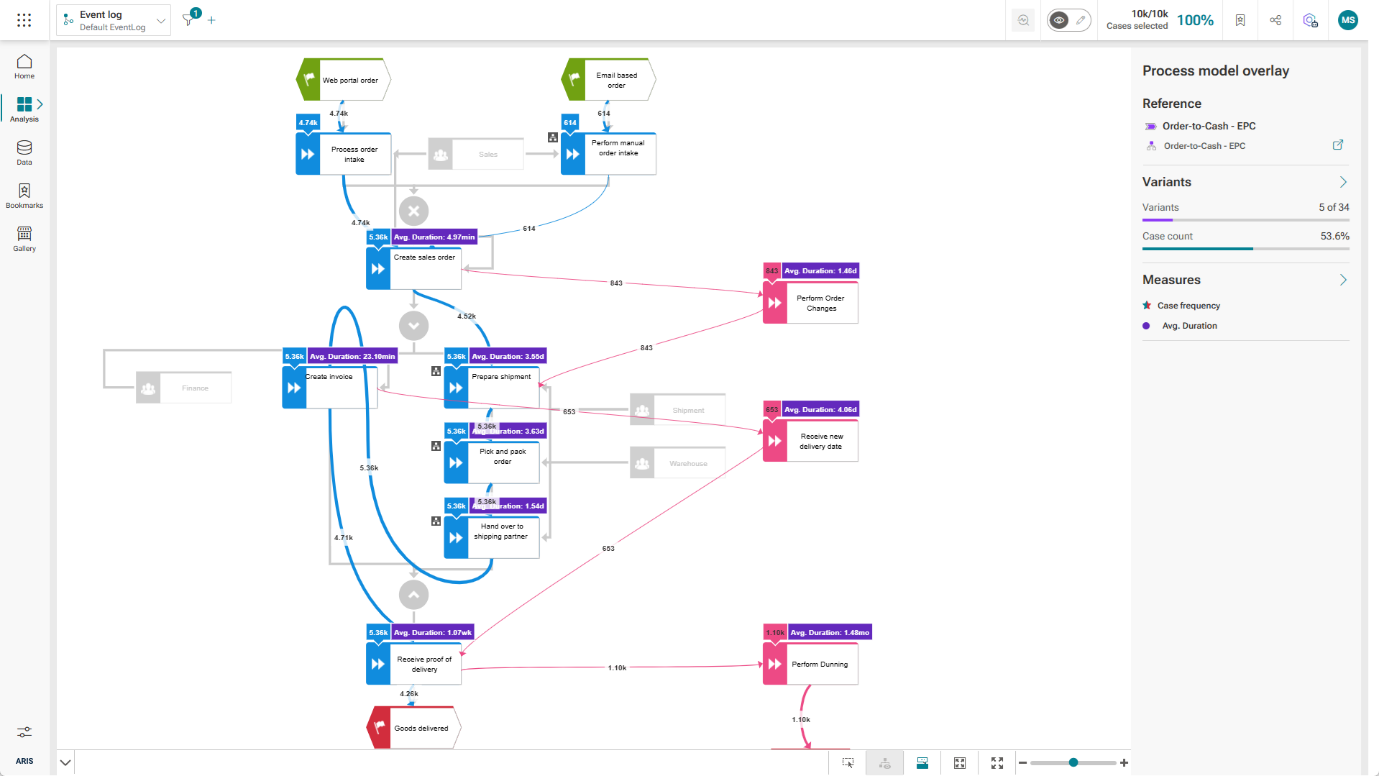
We’re excited to introduce a new feature in our platform designed to enhance how you analyze, visualize, and act on your process mining data. This release brings new powerful upgrades to the process mining: The support for EPC (Event-driven Process Chains) and further enhancements to our Process Mining overlay.
By seamlessly integrating process mining data with EPC models, we’re making it easy to derive insights, measure KPIs, and pinpoint areas for optimization in our customers processes.
Let’s take a look at the overlay for EPC-Models
Event-driven Process Chains (EPC) play a vital role for many of our customers in process modeling , enabling businesses to define and visualize processes in a structured way. With the introduction of the EPC overlay, users can now bring together process mining data and EPC models in a single view, enabling:
First, direct visualization of KPIs on EPC models like it is already possible for BPMN models. With the overlay, users can see relevant KPIs right in their process models, making it easy to compare and analyze data in real time. By embedding KPIs directly into EPC models, teams can easily monitor critical performance indicators, such as throughput times, bottleneck frequencies, or other KPIs directly on the structures process model, creating a unified analysis of process models and execution data.
This integration of EPC with process mining data represents a significant leap forward for users looking to combine their traditional process models with real-world insights. Not only does it provide a holistic view of the process landscape, but it also empowers more informed decision-making by linking modeled processes with operational metrics.
Second: The second part I want to cover are the general improvements we did for the overlay.
In response to user feedback, we’ve introduced enhancements to the Process Mining overlay, particularly in how edges (connections between process steps) display data. Edges now dynamically adjust in size based on the metrics they represent, creating a more intuitive, visual way to understand key values.
Edges with larger or smaller thickness correspond to higher metric values, and vice versa. This makes it quick and simple to identify variations and potential areas for improvement at a glance. With edge sizes reflecting process metrics, users can quickly pinpoint where their attention is needed, be it high throughput times, excessive delays, or frequent handovers.
This enhancement doesn’t just improve visualization; it streamlines the analytical workflow, letting teams focus on high-impact areas without spending time digging through extensive data tables or reports.
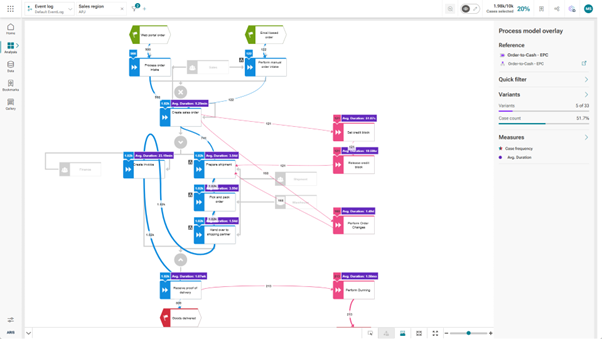
Another crucial upgrade in this release is the synchronization of the quick filter with the global filter. This means that any changes made to the global filter will now reflect immediately within the quick filter. In practical terms, this improvement ensures that all views remain consistent, reducing discrepancies and minimizing the chances of misinterpretation.
This cohesive filtering experience is especially valuable when analyzing processes from different angles or diving into a detailed process analysis.
With these new capabilities, our platform is more powerful than ever for process analysts, process owners, and business leaders.
Combining EPC models with process mining data allows users to make decisions based on both model-driven and data-driven insights. This unified approach leads to more informed, strategic choices.
Get Started Today!
Our EPC overlay and process mining enhancements represent a powerful leap forward in process analysis and visualization. With this new feature, users can now enjoy a more seamless experience as they model, analyze, and optimize processes within a single environment.
Try out these new capabilities today and experience how they can help you unlock deeper insights, make better decisions, and drive continuous improvement in your processes!


