MS

I see that there are still some "orphan" concepts in ARIS even in the current version where it would appear they have been forgotten about with no clear direction or method on their use.

Case in point the fishbone model - this should be a very easy piece to model but....it's not and doesn't appear to follow the usual format for creation.


Can anyone educate me please?


Cheers

by André Vitor Oliveira
Posted on Fri, 08/02/2019 - 16:57

Hi Marcos,

For this model type, there is an extension pack license for Six Sigma which is Business Strategy.

The Lean Six Sigma and Value Stream Mapping methods are available in ARIS.

- ARIS Connect: it is contained in ARIS standard

- ARIS Architect and ARIS Designer: it is part of the Extension Pack “Business Strategy"

Methods

- model type "Fishbone Diagram",

- model type "CtX tree" (Critical To Tree).

- model type "SIPOC diagram" (SIPOC = Supplier Input Process Output Customer)

- model type "Value Stream mapping" can be used to create to order process from supplier to the customer.

- object type "success factor" in different model types

The content of ARIS SIx Sigma is documented in the online help of Architect see "Special topics and functions" - Six sigma

BR


AO


0
by Eva Klein
Badge for 'Community Team' achievement
Posted on Wed, 08/07/2019 - 10:30

Dear Marcos,

The fishbone diagram analyzes a problem (concern) in detail to determine the cause of the problem (cause-and-effect diagram). The fishbone diagram supports you in identifying the root causes of the problem. All major problems are analyzed. One principle is that the question Why? must be asked at least five times to identify the root cause.

You can create and define a fishbone in the following way (ARIS Architect):

Example case:  We need to change the invoices.

  1. Write down the problem statement

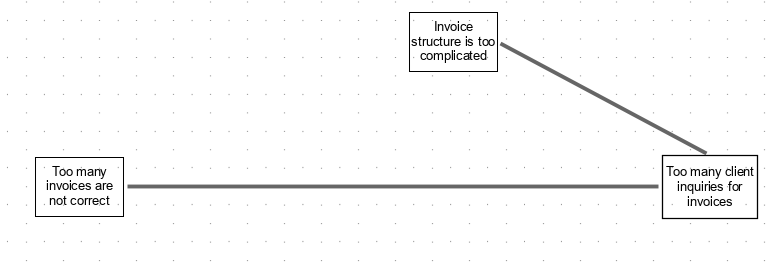
    Define the problem statement by asking “Why do we have to change the invoices”, e.g. “Too many client inquiries for invoices”. Add a Concern object to your ARIS fishbone diagram and name it.


    concern object - fishbone diagram

     
  2. Major Factors/ cause categories

    In the next step define the cause categories of the problem by asking “Why are there so many client inquiries for invoices”.

    - "Invoice structure is too complicated"

    - "Too many invoices are not correct".


    Add the answers as Concern layer 1 objects to the diagram. Afterwards add a connection between them and the Concern.


    Major Factors/ cause categories

    There are the traditional ‘fishbone’ major factors like: People, Equipment, Method, Materials and Environment. But it is not necessarily to stick to these.

  3. Brainstorm – Step 1

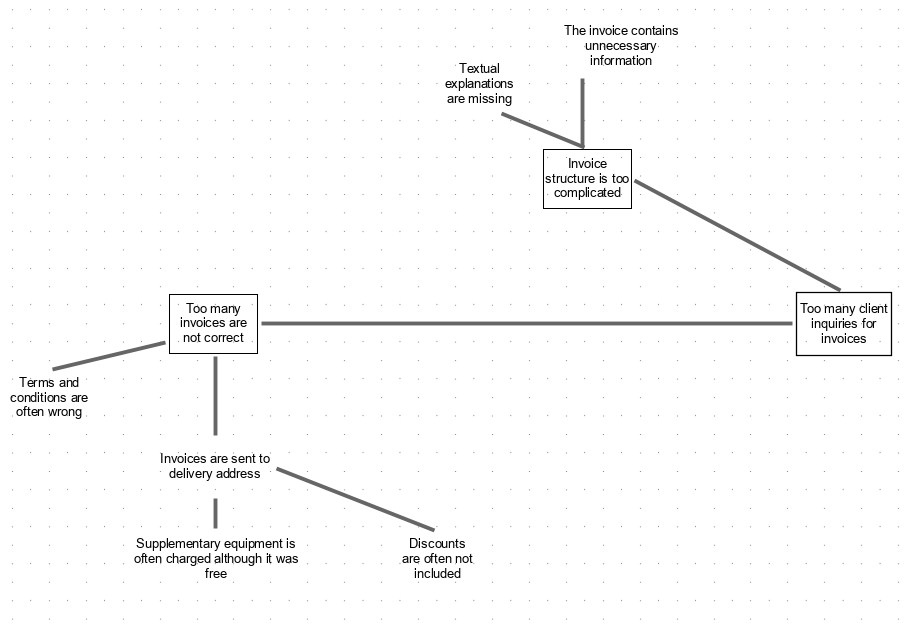
    Drill down into the issues. Group them into relevant subcategories. Keep going until you have a diagram showing all the possible causes. Ask “why does this happen?" and place the answer as a branch (concern layer 2) from the appropriate category (concern layer 1).  Add a connection between them and the Concern layer 1.

    Why are so many invoices being not correct?

    - Invoices are sent to delivery address

    - Terms and conditions are often wrong


    Why is the invoice structure too complicated?

    - Textual explanations are missing

    - The invoice contains unnecessary information


    concern layer 2

  4. Brainstorm – Step 2

    Again asks “Why does this happen?” about each cause (concern layer 2) and place the answer as a separate branch (concern layer 3) from the one before. Add a connection between them and the Concern layer 3.


    Why are terms and conditions often wrong?

    - Supplementary equipment is often charged although it was free

    - Discounts are often not included


    concern layer 3
  5. Brainstorming – Step 3

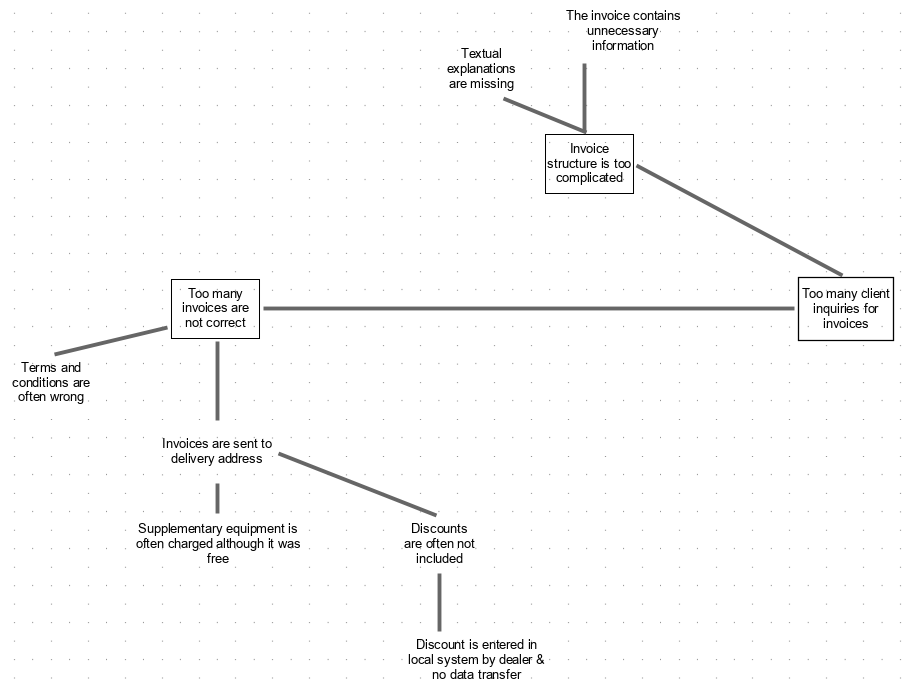
    Asks for the last time “Why does this happen?” about each cause (concern layer 3) and place the answer as a separate branch (concern layer 4) from the one before. Add a connection between them and the Concern layer 3.


    Why are discounts often not included?

    - Discount is entered in local system by dealer & no data transfer


    concern layer 4

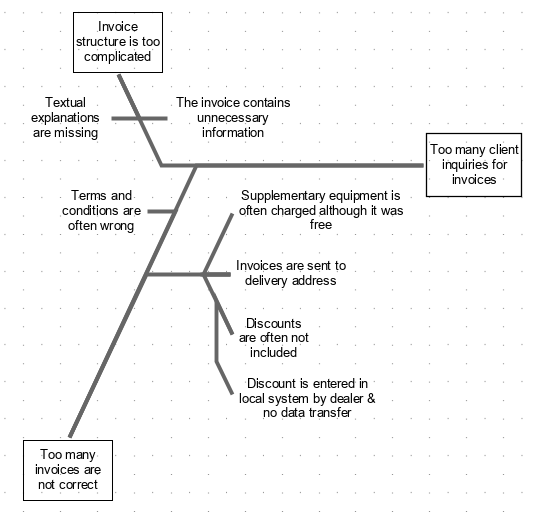
Finally, click Layout to structure the diagram in a better way.

Layout


fishbone diagram example

I hope this information will help you :-).

Kind regards,

Eva

0

Featured achievement

Question Solver
Share your expertise and have your answer accepted as best reply.
Recent Unlocks
  • CP
  • BZ
  • Profile picture for user TEF_Bernd
  • ПЦ
  • CR
  • PacMan

Leaderboard

|
icon-arrow-down icon-arrow-cerulean-left icon-arrow-cerulean-right icon-arrow-down icon-arrow-left icon-arrow-right icon-arrow icon-back icon-close icon-comments icon-correct-answer icon-tick icon-download icon-facebook icon-flag icon-google-plus icon-hamburger icon-in icon-info icon-instagram icon-login-true icon-login icon-mail-notification icon-mail icon-mortarboard icon-newsletter icon-notification icon-pinterest icon-plus icon-rss icon-search icon-share icon-shield icon-snapchat icon-star icon-tutorials icon-twitter icon-universities icon-videos icon-views icon-whatsapp icon-xing icon-youtube icon-jobs icon-heart icon-heart2 aris-express bpm-glossary help-intro help-design Process_Mining_Icon help-publishing help-administration help-dashboarding help-archive help-risk icon-knowledge icon-question icon-events icon-message icon-more icon-pencil forum-icon icon-lock