
Introduction
Usually enterprises want to be successful in what they do. A prerequisite for being successful is having the required capabilities to reach the set goals, a capability being an ability to generate a certain outcome. Managing and developing these capabilities is what Capability-Based Planning (CBP) is concerned with.
This article introduces CBP and then describes its support in ARIS. This support comes in the form of a showcase which is shipped with ARIS and which provides meta-model extensions, modeling examples in the ArchiMate® notation and evaluation tools.
Capability-Based Planning
The idea of CBP is to focus investments on capabilities that give the enterprise a competitive advantage, e.g. because they provide an outstanding value for the customer or large efficiency gains for the enterprise, and reduce investment in capabilities that don’t. In order to direct investment decisions accordingly, CBP proposes a cycle of four steps.
The first step is to identify and document the capabilities required for the enterprise to be viable and successful. A common approach is to start with a set of broad, high-level capabilities, e.g. derived from the business strategy, and to decompose each of them into more specific ones, thereby creating a capability hierarchy with a fixed depth between two and four levels. For example the capability Logistics Management might be broken down into the capabilities Warehouse Management and Transportation Management. In order to facilitate the subsequent capability analysis and improvement, it should also be specified which strategic goals each capability supports and by which processes, applications, organizational units and other resources it is realized.
The second step is to evaluate the capabilities for the purpose of finding out where to invest and where to divest. This involves the definition of suitable analysis metrics, the assessment of each capability according to these metrics and the preparation of the results. Each capability can have its own set of metrics that suit its nature (e.g. the average amount of time taken to solve customer issues for the Customer Support capability) but there are also metrics that can be used for any capability, like business value or performance (measured on a generic qualitative scale). For metrics that can be influenced by the organization, like the performance of a capability, as-is and to-be values are determined whereas for those that cannot be influenced, like the business value, only one value is recorded. Graphical representations of the gathered information subsequently help with the decision-making. Those can e.g. be portfolio diagrams with quadrants proposing certain actions, heat maps that show performance gaps or spider charts with sub-metrics of a measure which allow more fine-grained adjustments to be derived.
The third step is to plan the development of new capabilities or the optimization of existing capabilities. The future realization stages of these capabilities are devised and put on a timeline, the necessary resources to reach these stages are allocated and related projects are scheduled.
The fourth and last step is to monitor and control the implementation of the plan. The progress is checked with respect to the timeline and use of resources and the effects of the changes are measured according to the metrics defined earlier. This can lead to the plan being adapted in order to counter-steer undesired developments and therefore a jump back to the third step. In case the enterprise strategy changes and a new capability identification and assessment is advised, it can even become necessary to carry out steps one and two again. So while the concept is meant to be a cycle, each step can be revisited out of order when the need arises.
This was just a very short introduction to CBP which left out much of the interesting and important details. A possibility for diving deeper into the topic is the Open Group Guide “Capability-Based Planning: Supporting Project/Portfolio and Digital Capabilities Mapping Using the TOGAF® and ArchiMate® Standards” which has been published in July 2019.
Business Capability Management Showcase in ARIS
ARIS is able to support CBP with all sorts of functionalities. Its repository makes it possible to capture and manage capabilities with all their connections to other assets in the enterprise architecture, like goals, processes, applications, resources or projects. Custom metrics and KPIs can be defined with its adaptable meta-model. The stored information can be evaluated with pre-defined and custom-made reports and dashboards.
A part of this support is demonstrated by a showcase that is included in ARIS 10.0 SR8, released in April 2019. It contains demo content in the ArchiMate® notation, custom attribute types for the capability assessment metrics and scripts for the evaluation. It thereby covers the documentation and evaluation phases described above but not the planning and monitoring phases. (That’s why it’s called Business Capability Management showcase and not CBP showcase.) The respective files can be found in the folder Content/ArchiMate v3.0/BCM Showcase on the ARIS installation medium.
Capability Modeling
Examples for capability modeling can be found in the demo database ArchiSurance demo - official style. (Before looking at those, make sure you have imported the filter ArchiMate 3.0 filter.) Most of the content in the database stems from the official ArchiSurance case study provided by the Open Group. ArchiSurance is a fictitious insurance company.
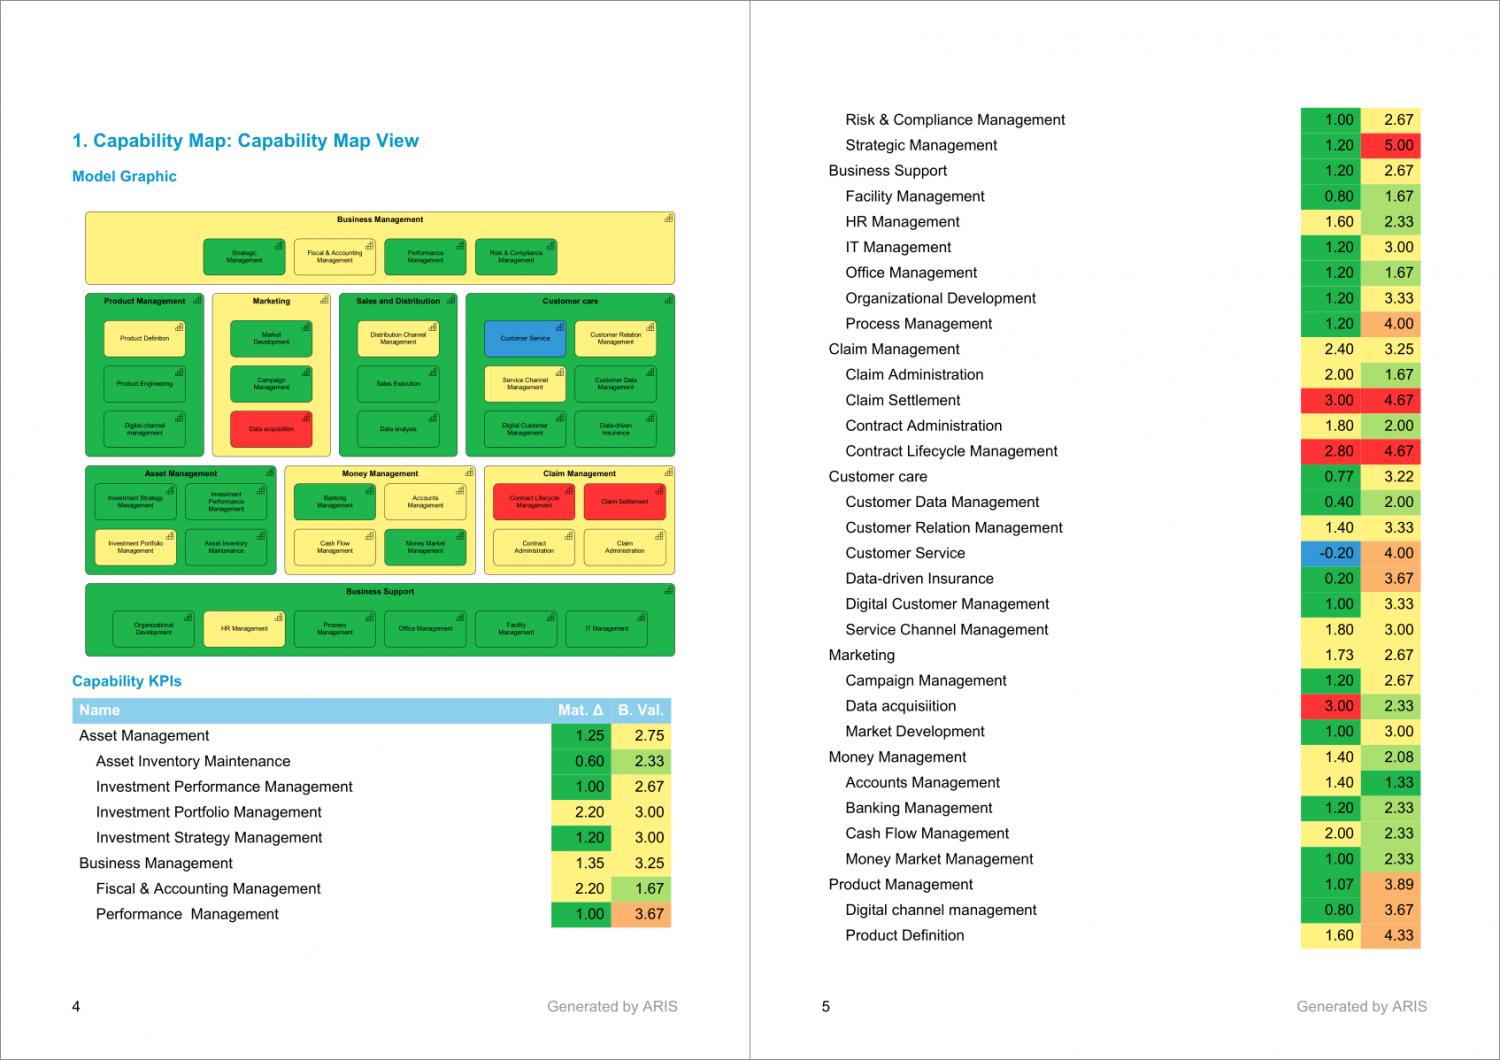
The first example is a capability map which is realized with the Capability Map Viewpoint. The respective diagram is called Capability Map View and located in the group Main group/ArchiSurance/Views. It is displayed in the following figure.
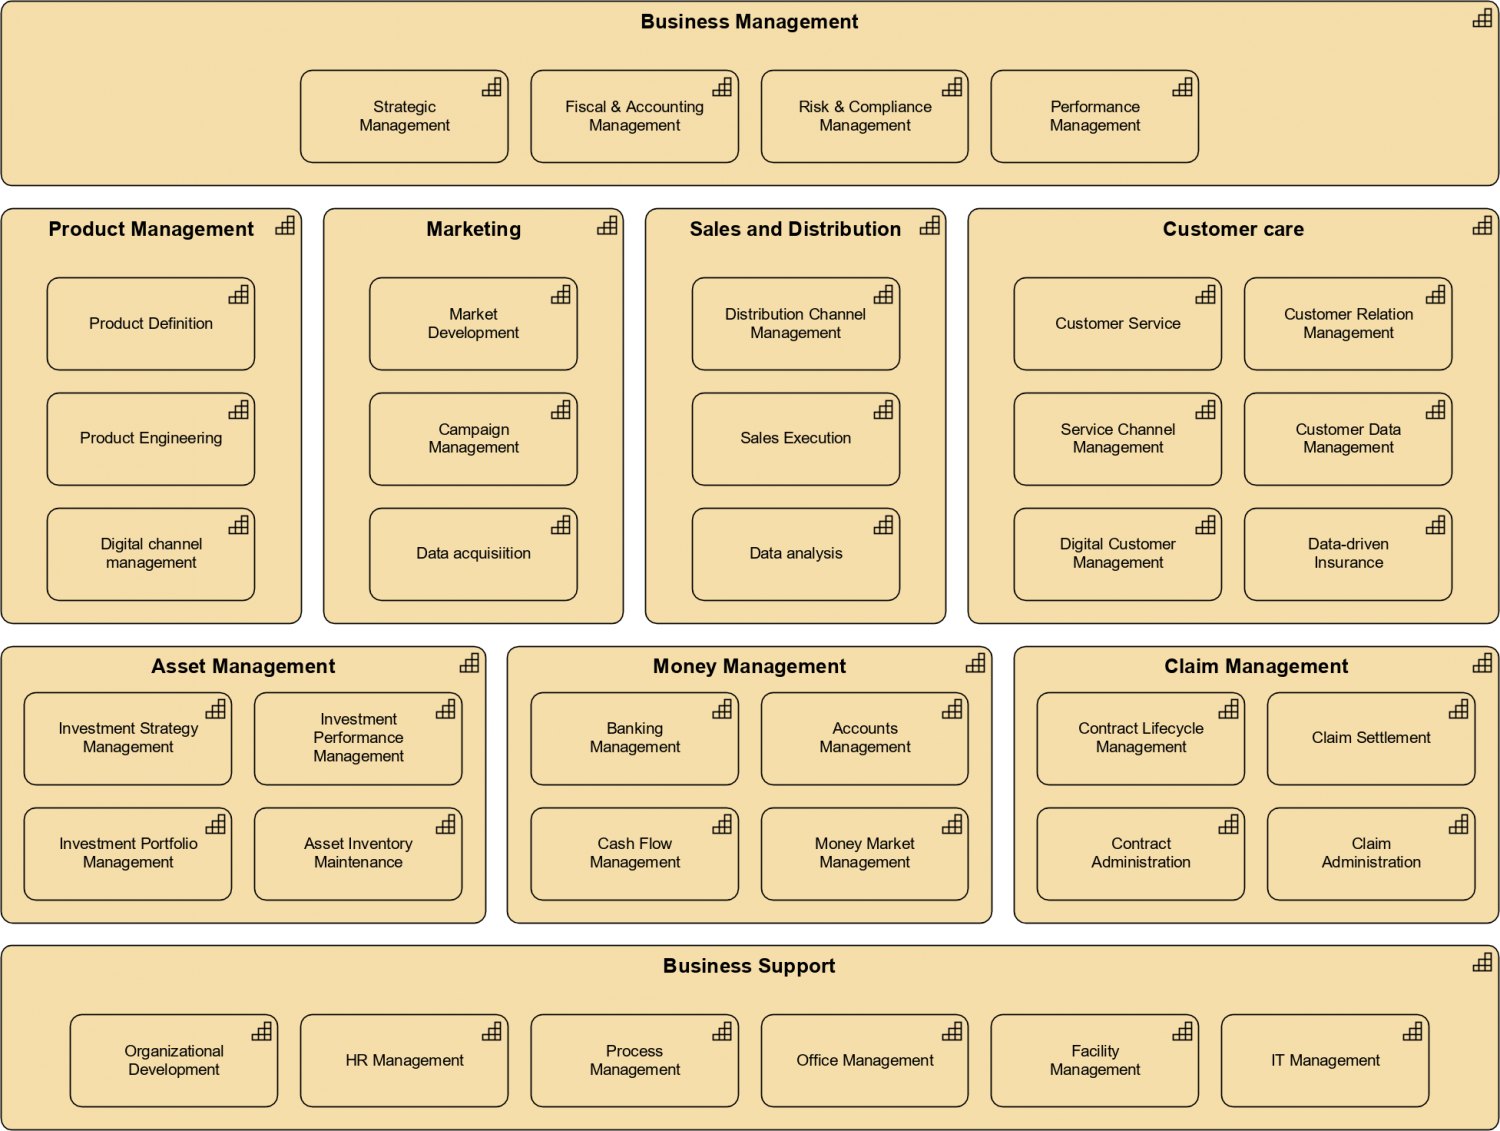
The diagram displays the capability hierarchy of the demo company on the first two levels. For example, it shows the top-level capability Marketing encompassing the subordinate capabilities Market Development, Campaign Management and Data Acquisition.
The second example, the realization of a capability, is shown in the diagram Capability Realization which is located in the same group. See the following figure.
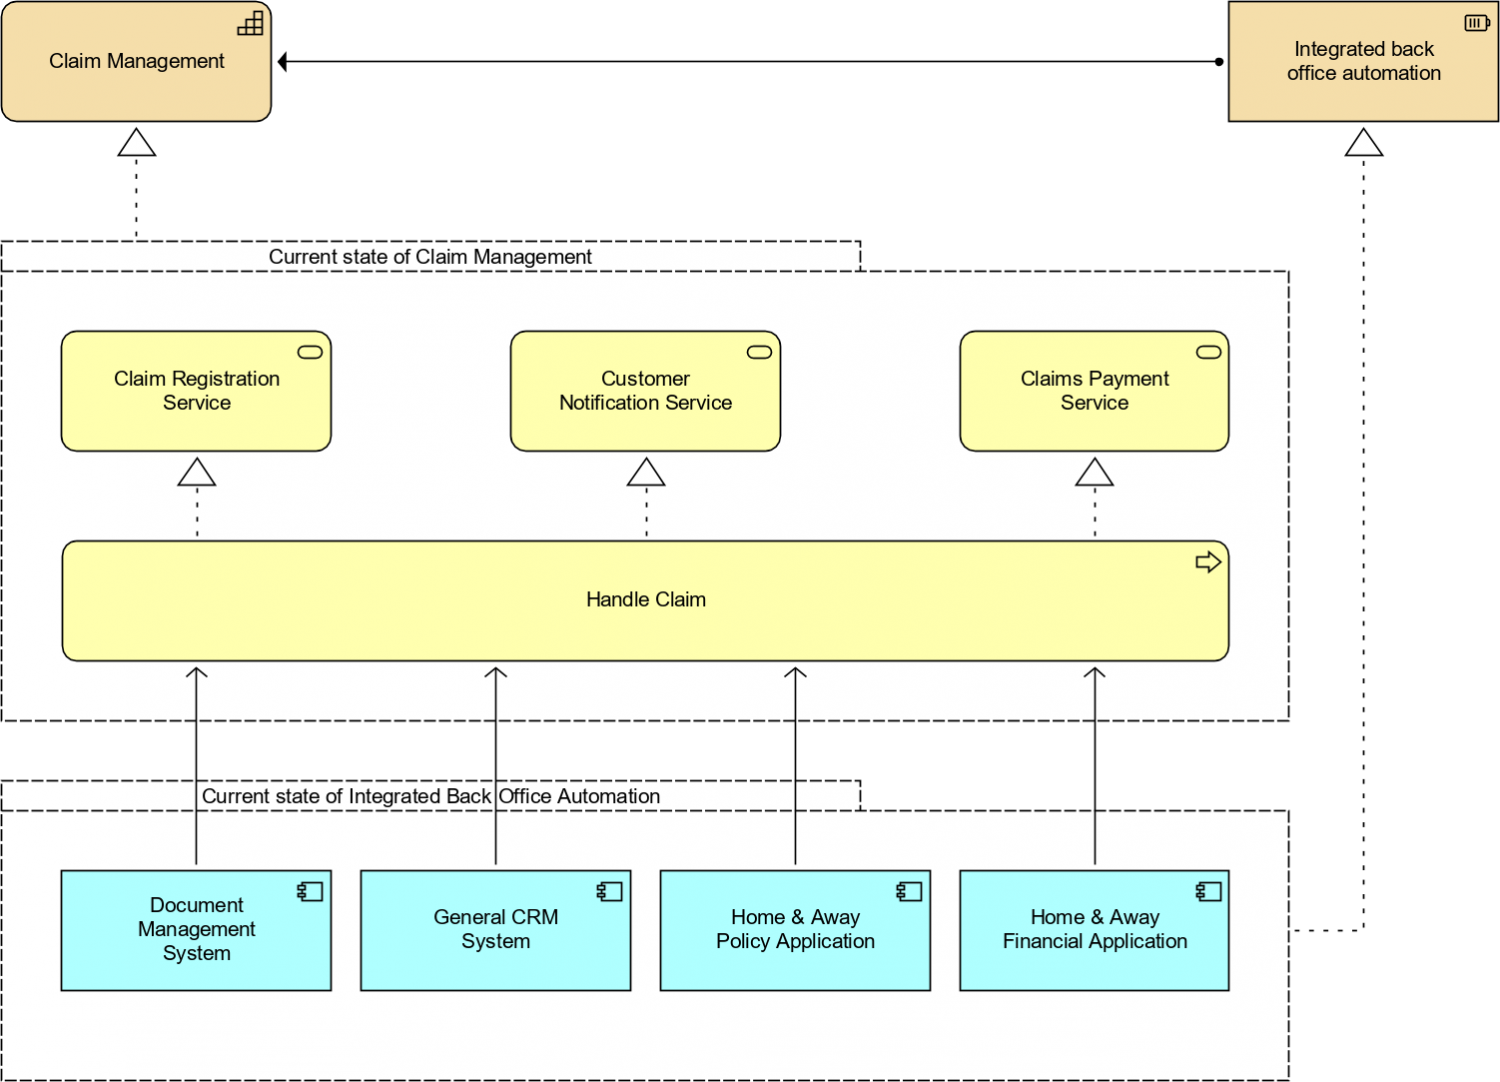
The capability Claim Management is realized by the three business services Claim Registration Service, Customer Notification Service and Claims Payment Service as well as the business process Handle Claim which provides the business services. The four application components Document Management System, General CRM System, Home & Away Policy Application and Home & Away Financial Application serve the business process. They also realize the resource Integrated back office automation which is assigned to the Claim Management capability.
The diagram shows the as-is state of the capability realization. Should the capability assessment reveal a problem with the Claim Management capability (spoiler: it will!) then a new and better realization would need to be developed and documented in such a diagram as the to-be state. Reaching this state could also be a step-by-step process documented in multiple diagrams showing multiple evolution states. Don’t be disappointed if this is not demonstrated in this article, but as mentioned before, the planning phase is not covered yet by the showcase.
Capability Assessment
Metrics
The capability assessment in the showcase is based on two main measures: Business Value and Maturity Gap.
The Business Value expresses the importance or criticality of a capability for the enterprise to be successful. It is divided further into the metrics Market Differentiation, Cost Savings Potential and Revenue Contribution, which can be ranked qualitatively with the values Very low, Low, Medium, High and Very high. The Business Value is calculated as an average of those.
The Maturity expresses how well the enterprise has mastered (as-is state) or wants to master (to-be state) everything related to a capability, like carrying out processes effectively and efficiently, training and appointing people with the right skills or having capable information systems. The metric is therefore broken down further into the five dimensions Process, People, Technology, Information and Communication. For each of those a qualitative ranking has to be given, both for the as-is and the to-be case. Maturity values are then calculated as an average of the dimension values. The Maturity Gap is calculated as a difference of the to-be and as-is values. The reason for using the Maturity Gap and not the (as-is) Maturity directly is that not every capability needs to be as mature as possible, e.g. because its importance is not very high. Using a gap allows such cases to be expressed.
In order to be able to maintain the capability properties described above in ARIS, the necessary attribute types have to be created. You can do this by importing the filter BCM with ArchiMate which is also part of the showcase. After you have done this, the following attribute types are available for capability objects:
- Business value
- Business value [group]
- Revenue contribution
- Cost savings potential
- Market differentiation
- Maturity (actual)
- Maturity (actual) [group]
- Process maturity (actual)
- People maturity (actual)
- Technology maturity (actual)
- Information maturity (actual)
- Communication maturity (actual)
- Maturity (target) [group]
- Process maturity (target)
- People maturity (target)
- Technology maturity (target)
- Information maturity (target)
- Communication maturity (target)
- Maturity gap
You only have to maintain the attributes in the groups and those only for the capabilities on the lowest level. The report described in the next section takes care of the rest.
Heat Maps
Once you have maintained the values in the Business Value, Maturity (actual) and Maturity (target) groups, you can run the report Calculate KPIs and colorize objects on the capability map. (The report is also part of the showcase. Make sure to import it from the installation medium.) The report will calculate the values for the attributes Business value, Maturity (actual), Maturity (target) and Maturity gap. It will also let you turn the capability map into a heat map by colorizing the objects based on the values of one of these attribute types. Per default the maturity gap is used. The result will look something like the following screenshot.
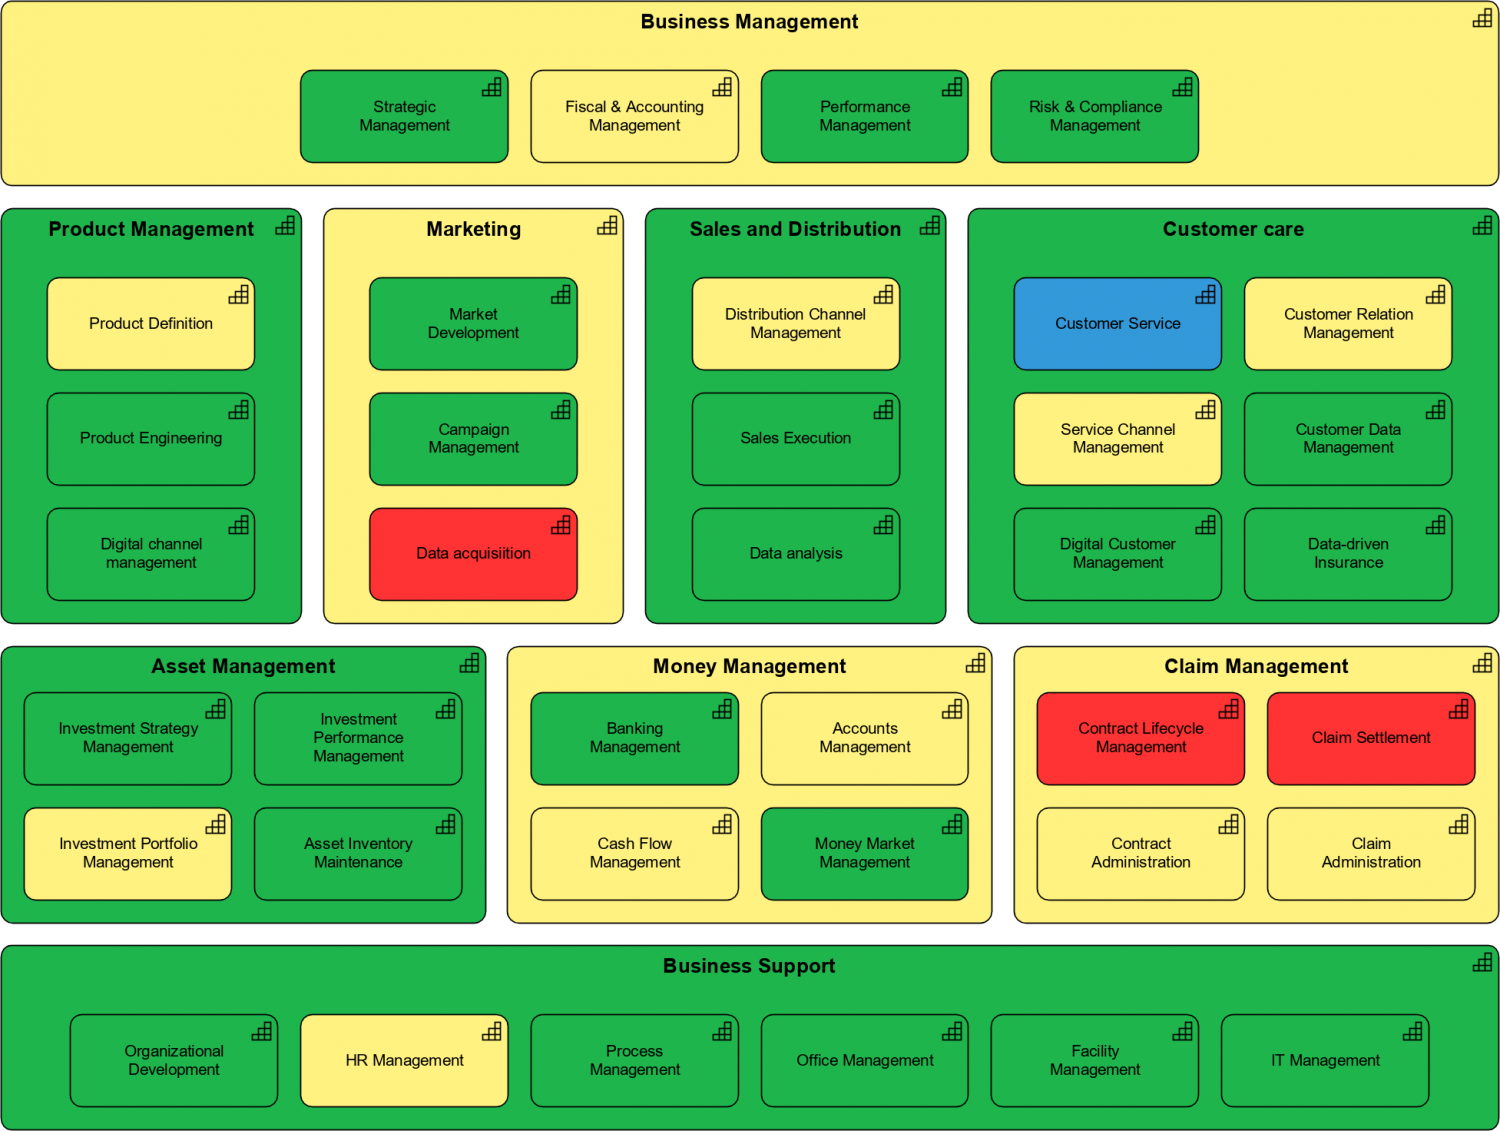
Capability objects in red have a large maturity gap, objects in yellow a medium gap, objects in green a small gap and objects in blue a negative gap, i.e. the actual maturity is better than the desired one. This graphical representation of the maturity gaps makes it very easy to identify areas where actions might be needed. In this example those apparently are the capabilities Data acquisition, Contract Lifecycle Management and Claim Settlement which all have a large maturity gap.
Let’s look at the business value of these capabilities to find out how serious the existence of these gaps is. This can be done by running the report Calculate KPIs and colorize objects again and selecting the business value as the parameter to be used for colorization. The result is shown in the following image.
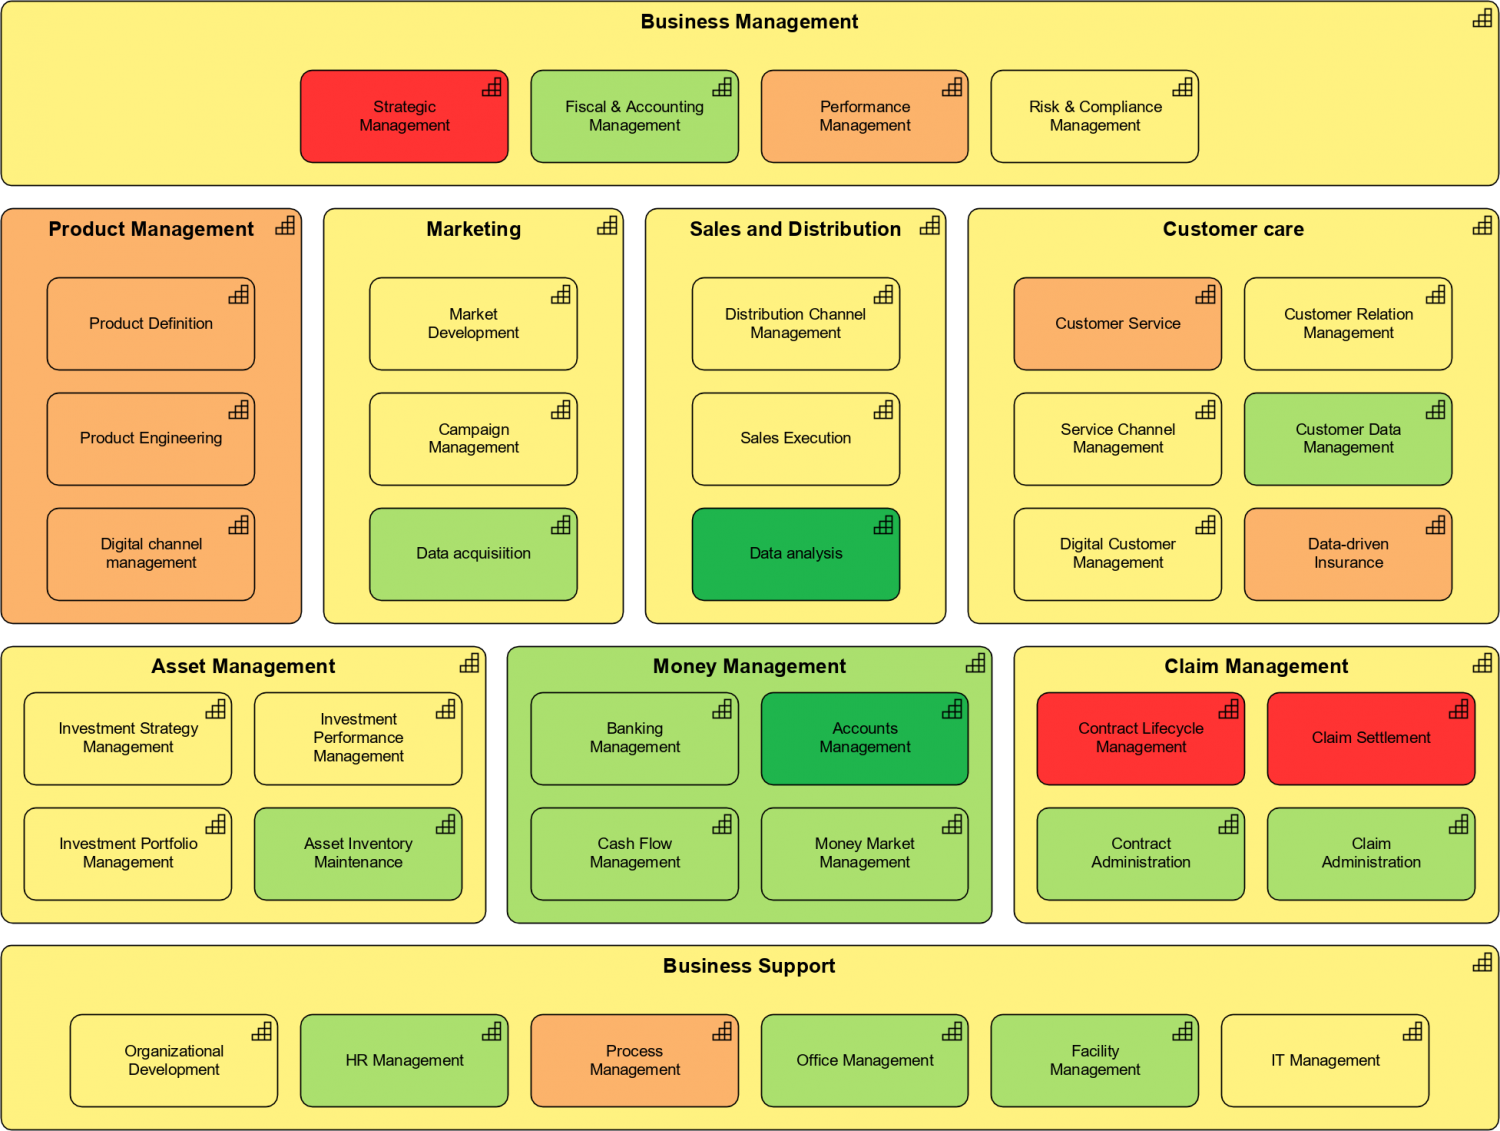
The objects can have one of the five colors red, orange, yellow, light green and dark green which correspond to a very high, high, medium, low and very low business value respectively. Looking at the capabilities with a large maturity gap we can see that Data acquisition has a low business value and Contract Lifecycle Management as well as Claim Settlement have a very high business value. So, even though all three of them have a large maturity gap, addressing this gap in the latter two capabilities is more important. Depending on the exact maturity dimensions that are the cause for the gap, an improved realization should be planned and implemented. As mentioned before, this step is not covered in the showcase yet.
Capability Summary Document
For the evaluation of capabilities the showcase includes another report called Create capability summary which you can run on the capability map or on selected capabilities and which generates a document with a lot of detailed information about the capabilities, provided it is maintained in the repository. The following screenshots show the aspects that are covered.
The first two screenshots show overview information for all capabilities.
If the report was started on a model, the model graphic will be included in the output. So if you ran the colorization report before, you will get a nice heat map in the output.
After the model graphic a tree list with all capabilities is included. For each capability its maturity gap and its business value are displayed, since both are important for decision making as demonstrated before. The metrics are shown both with their numeric and their color values. The colorization is the same as in the heat maps. Just check out the two capabilities in the list with the red maturity gap and the red business value. Those are the same as the ones we found by looking at the respective heat maps.
The second two screenshots show detailed information for a capability and its sub-capabilities.
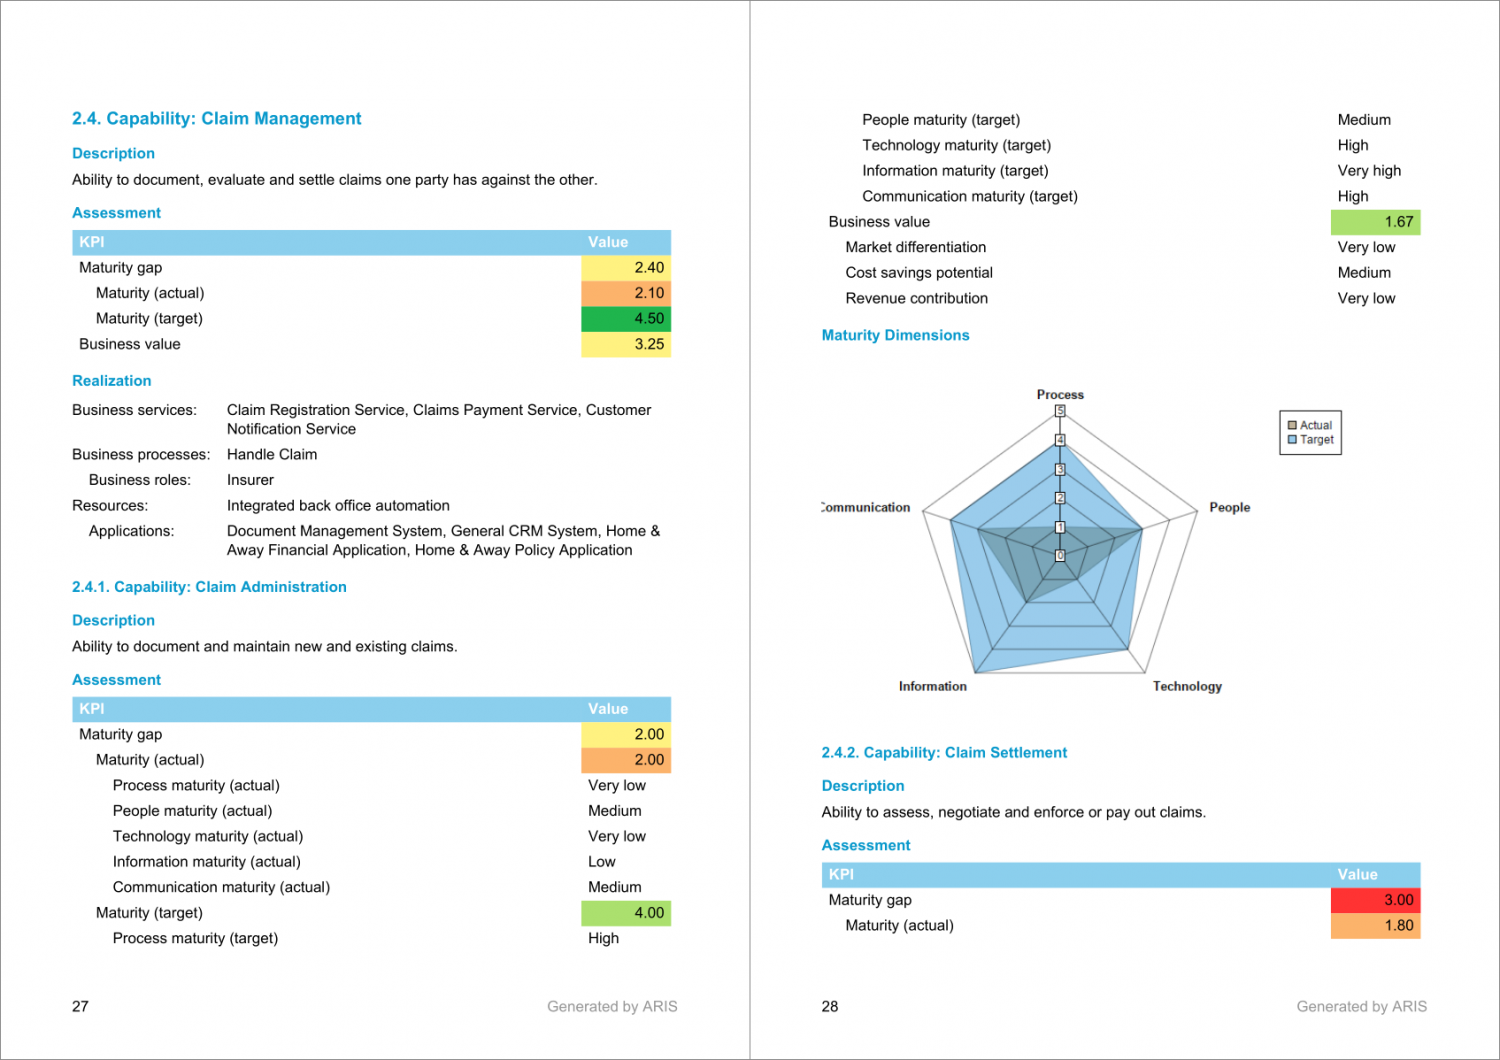
Information about a capability includes its description, its assessment details and connections with other architecture artifacts. Besides the KPIs for business value and maturity, the assessment information will include the values of the low-level attributes that are used to calculate them. For the maturity dimensions a spider chart will be generated which facilitates the comparison of as-is and to-be values. It also allows you to see right away on which dimensions improvement initiatives have to focus. Connections with other artifacts can be related to the strategic impact of a capability, like realized outcomes or supported goals, but also to its realization, like the business services, processes, roles or applications that are used by it.
Such a document can come in handy when you need the respective information on the go or want to provide it to somebody who has no access to the EA repository. In the showcase it is also the only way to get those nice spider charts for the maturity dimensions.
Outlook
That’s been a quick run-down of Capability-Based Planning and the Business Capability Management showcase in ARIS. I hope you enjoyed it. There is still potential to develop the showcase further, e.g. by adding dashboards, covering the missing CBP phases or supporting other notations. Let me know in the comments what you’d be interested in.
Tanguy Petre on
Great showcase, thanks Ralf! Dashboard is interesting of course. I am also interested in the next steps as this will lead to project(s), to be design, development, ...
Do you consider using variant for target capabilities? Once project starts, how to maintain project scope and process modeling in a more detailed than one object in an Archimate model? (I have heard that Archimate next release will include process models (assigned to process object))
Cheers
Tanguy