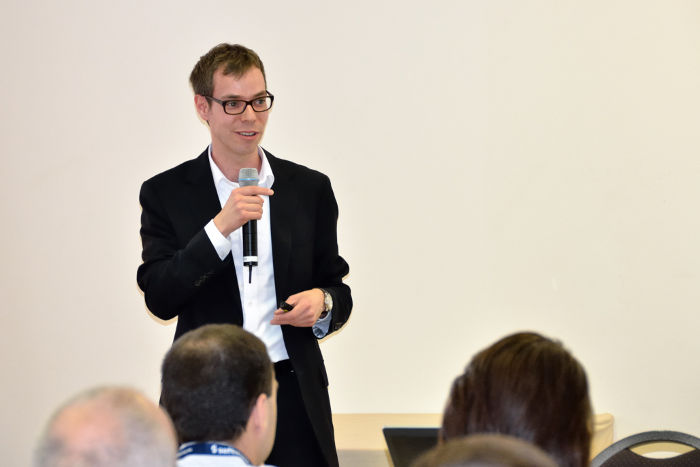
Dr. Dominik Vanderhaeghen now presents how unified process intelligence can help us to run our business not on Trial & Error. Instead, we want to be able to learn from what we are doing so that we don’t repeat the same errors over again. A key ingredient provided by unified process intelligence is providing pictures of the current situation so that we understand what we are in.
Dominik highlights the difference between process intelligence and business intelligence. In business intelligence you mainly measure the outcome of some processes. In contrast, process intelligence gives the insights by measuring how the processes are performing.
The unified process intelligence solution consists of several levels, e.g.:
- analyze & report to understand why something is not as expected,
- alert to get notified when something goes wrong,
- and finally detect to understand what is causing the problem so that you can fix it.
All those levels are supported by visualization so that you don’t need to delve through log files or scroll endless columns of Excel spreadsheets. It’s key to process intelligence that you can detect a problem with a brief daily look on your main dashboards.
Dominik has a nice picture illustrating why visualization is so important. First, he shows a net of 170,000 process instances. Then, he shows how ARIS PPM can abstract from that e.g. only showing the flow of similar process instances.
For ARIS 9, several new features are planned to ease the use of the different tools. For example, single-sign on and shared user management will simplify the administration of the tools. You can also mix interactive PPM charts with other MashZone visualizations. And as already mentioned in the morning, the analysis capabilities of the tools are extended to not only cover process data, but all kinds of data in general.
The presentation ends a bit early and participants are heading now for lunch.


