
Hello. Getting more familiar with mashZone, I was able to monitor the Bus. Designer sessions accounting with mashZone. It is incredibly simple !!
First, we need to define the data feed. Accounting produced on the server is in XML format, breaking by month.
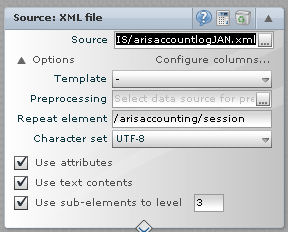
The XML repeat element is: "/arisaccounting/session" and the char set is UTF-8 with ABD 7.1
We then need to change the precision of the login and logout fields to only keep the day.
We add a column to count the sessions.
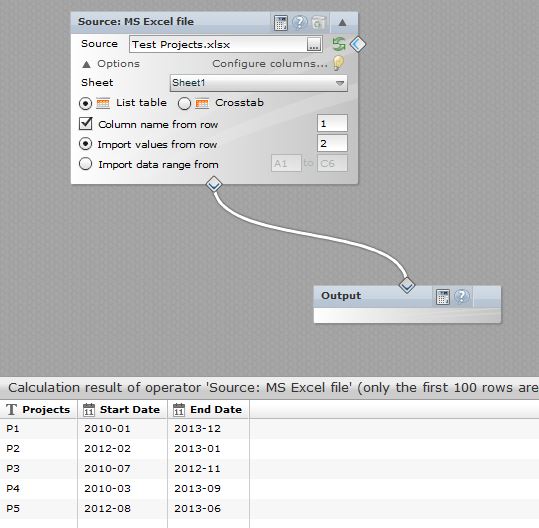
That's it for the data feed !!.
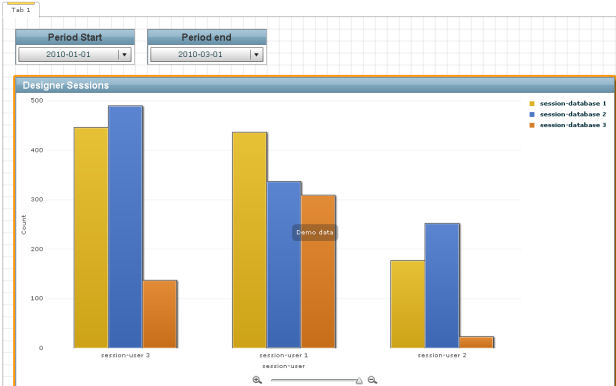
The cockpit needs a column chart called "Designer Sessions" and 2 Selection boxes to filter by day, like below:
The data assigned to the Column chart is shown here:
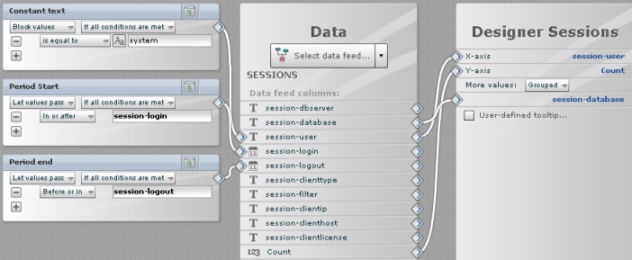
The data feed is the one created before. The user "system", used for batch activities is excluded. The session-user is on the X-axis, and Count on the Y-axis. The session-database is used to represent which databases have been used. Zoom, Legend and Shadow are set in the Column chart settings
Selection boxes can be used to filter a starting and ending period.
The results is remarkable. The double zoom features works extraordinary well in conjunction with the scroll bar.
Here a snapshot for January 2010:

An outstanding diagram produced in an hour or two, thanks to the examples in this community, as I just discovered mashZone a few days ago. Enjoy !
Pierre Pilven on
Hey Thierry,
Could you please tell me where is located your source file arisaccountJAN.xml ?
I did'nt find it on my Aris Install Directory and i'd apprciate to test your tutorial...
Regards.