
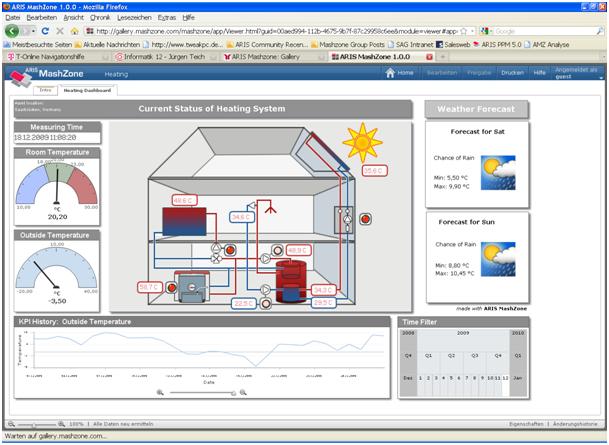
Probably you have seen the Heating MashApp on the gallery server as a fancy example of what you can do with ARIS MashZone.
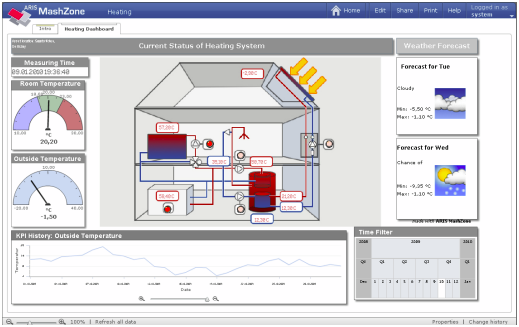
But it is much more than a fancy example – for me it’s reality at home. So in fact what you are looking at in this MashApp is my personal heating system at home. Ok, the update of the data is currently done only manually, but at home (in my local intranet ;-) I can see the data in real time (especially with the upcoming 1.0.1 version from MashZone that support real time refresh).
For those of you that are interested in the technical detail here some background info. I will focus on the visualization of the current status, maybe I will explain the weather forecast on the right-hand side and the historical data at the bottom in another blog post.
The heating system is a Solvis Lino boiler with solar panel for hot water production. The whole asset is controlled by the SC1 control from Solvis which is indeed an OEM of the UVR1611 from “Technische Alternative”. The cool thing with this control is that you can buy a web interface (Bootloader BL-NET) that provides a recording of all actors and sensors, as well as an online interface to the current status.
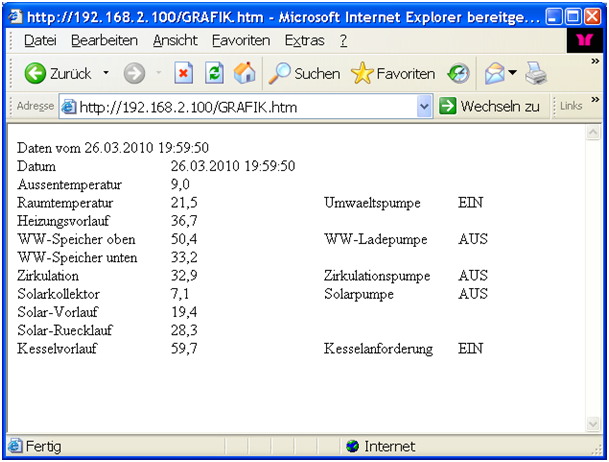
So this is the hardware infrastructure, but how to get the data into MashZone? You can configure a simple web page that delivers the current status of the system. In my case by calling http://192.168.2.100/GRAFIK.htm from the web interface I get the following page (sorry, it’s in German):
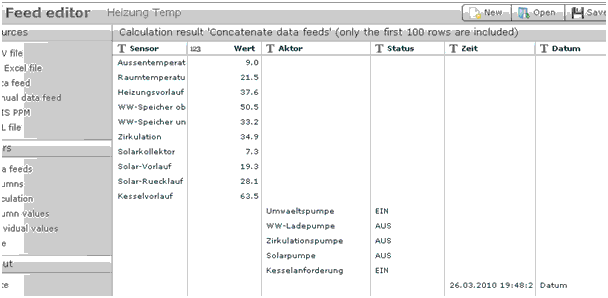
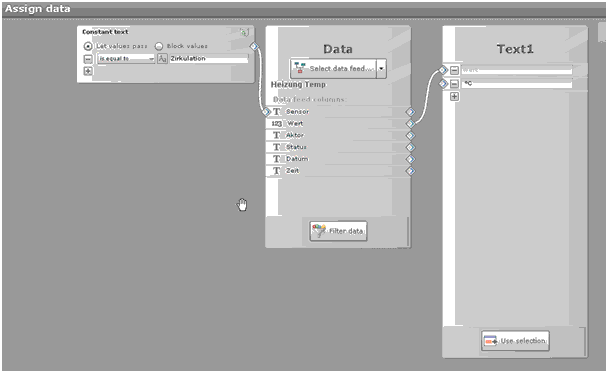
I directly read this page from MashZone (as HTML is XML as well, at least when it is correct XHTML ;-). With some feed processing I split the data to be separated by sensor and actor information:
In the end, the feed delivers the data as follows:
The visualization is done by overlaying a background image with text fields (for the temperature) and images for the status of the actors (pumps). The overlay of the text field is quite simple, as you can feed the output of a feed into such a text box; you just have to filter on the correct value, e.g:
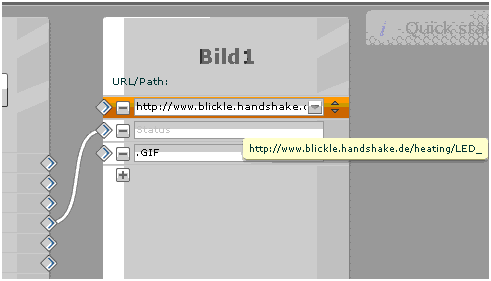
For the dynamic images there is a little trick: As the lights of the pumps should be on and off, I am using two different images. The image is selected depending on the data, hence I put the data value in the names of the images:
On: ![]() Name: “LED_EIN.GIF”
Name: “LED_EIN.GIF”
Off: ![]() Name: “LED_AUS.GIF”
Name: “LED_AUS.GIF”
Depending on the value provided by the feed (“EIN” (which means “ON”) and “AUS” (which means “OFF”) ) a different URL is requested and a different picture is shown.
This way, the light are turned on and off within in the MashApp. BTW the same trick is used to show the sun shining:
You see – it’s not a fake.


Markus von den Driesch on
Really cool and something completely different as we think of when we started the Mashzone idea.
The only thing missing is to let the viewers set the temperature for your living room remotely;-)