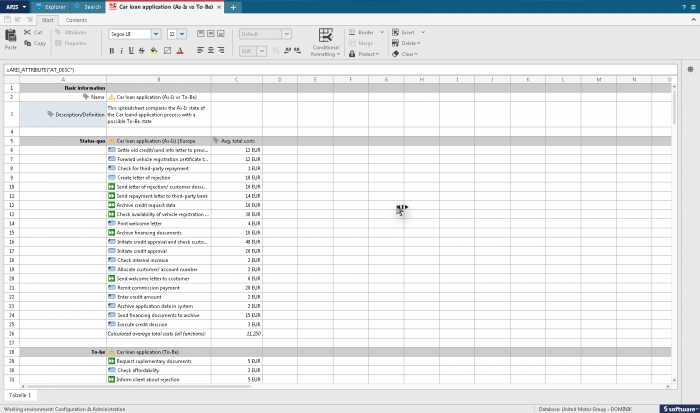
Since ARIS 9, a new capability called Spreadsheet is included in ARIS Architect and ARIS Designer. This Spreadsheet is closely related to the new new analysis functionalities that have been described by Philipp before. This is article belongs to other articles related on the TOP features of ARIS 9 – so check out as well what Nina wrote about the new user interface and pictogram EPC symbols. But let’s come back to the article topic I want to cover: Spreadsheet.
If I am forced to describe the Spreadsheet functionality just in a few words, I would say that is a simple and easy-to use calculation tool within ARIS - similar to popular functionality known from office suites.
Why do you need it?
ARIS is great to describe process architectures, organizational structures and or IT architectures. You design models of your current or desired architecture and enrich those models with important information about – e.g. costs (the average cost of process or cost rate of an organizational unit) or times (e.g. the cycle-times of a certain process step) or… whatever. As modeling in ARIS is also about describing structures, you might wonder what the average total costs of a business process are – something which is calculated based on the average total costs of your functions that are executed in the process.
How to use it?
Spreadsheet comes in two modes – the dynamic and static spreadsheet. The standard “static” spreadsheet is a new model type that you use to create your own calculation. Within a spreadsheet, you refer to ARIS models, objects and attributes and apply popular formulas like e.g. SUM(), AVG()…
To do so, you first need to refer to ARIS elements based on new formulas which are applied similarly to standard spreadsheet functions. If you want to get the attribute value Y of e.g. a function X, you need to specify
- The element your are interested in via =ARIS_ELEMENT("580d3f2a-fca8-11db-2729-000bcd0cce4e") - NOTE: You can also copy & paste objects into a cell and the GUID is automatically populated
- The attribute (type) you are interested in via =ARIS_ATTRIBUTE("AT_COST_AVG_TOT") - NOTE: You do not need to knowt the API name (AT_) - as an end user you can easily chose from the list of available attributes
And as a final step you now "calculate" in a cell the current value of the attribute of your element like for example =ARIS_ATTRIBUTEVALUE($B6;$C$5).
See the example below.
It is really quite simple. Everyone who is familiar with spreadsheet tools will be able to work with Spreadsheet in ARIS as well. You just need to get familiar with the three new formulas for refering to ARIS-specific content.
The dynamic spreadsheets are an output format of the analysis capabilities described by Philipp. They work more or less the same way except that you build up your spreadsheet based on analysis query defined before.
This functionality gives you and your creativity everything you need to make calculations happen based on what you have described and stored in ARIS. We – on purpose – do not restrict this functionality to special use-cases as we know that you have very different scenarios to apply this functionality. It might be Activity-based Costing (ABC), supporting your Balanced Scorecard (BSC) or an IT Costing scenario or...? But it might be as well a bulk change of attribute values (e.g. entering the times for a lot functions within a process) which will be much easier to do based on the new Spreadsheet.
If you have questions, please let me know and stay tuned for the next post about “Central user and license administration and management”!


Lisa Imbert on
Hi,
I have a question about KPIs and Process analisis.
Are the KPIs and Process analisis based on the data I enter into the sistem? (If I use Aris without a connection woth Webmethods for exemple). Or does Aris connects to others sistems to gather those KPIs/process analisis.
Thank you in advance
Regards
Lisa Imbert.