
Hello Community,
I think it is time now to start with the first data listing out of Aris Architect. You may have seen the Hello World, and already tried it. This time the number of commands will grow, but the main steps are the same.
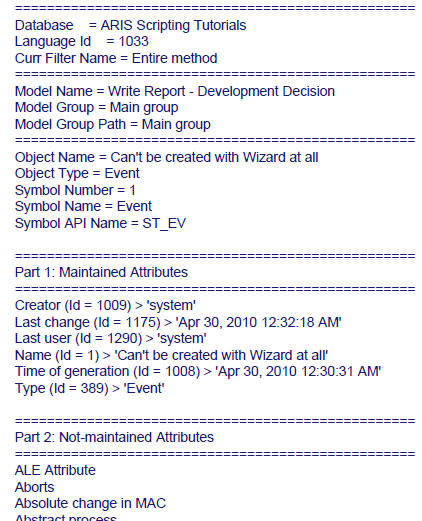
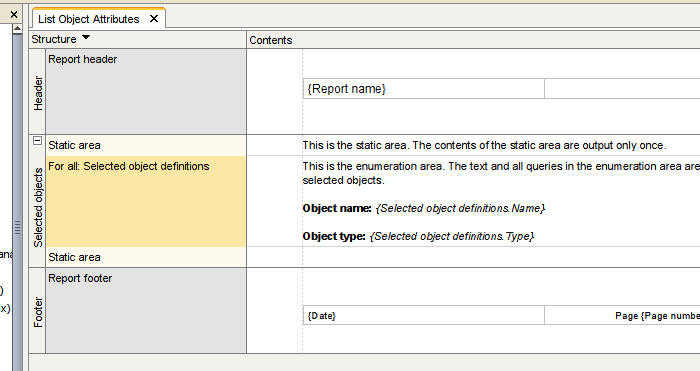
What we are going to do is this listing, a plain list of main model attributes + attributes from selected object occurences. To run it, open a model of your choice, select one or many functions and run the report, You will get a list like this:
Now, let's start how to build this:
Step 1: Create, if not yet done, a new Category for your custom reports.
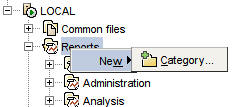
Step 2: Name it accordingly, to identify the content
![]()
Step 3: And begin now with a new report

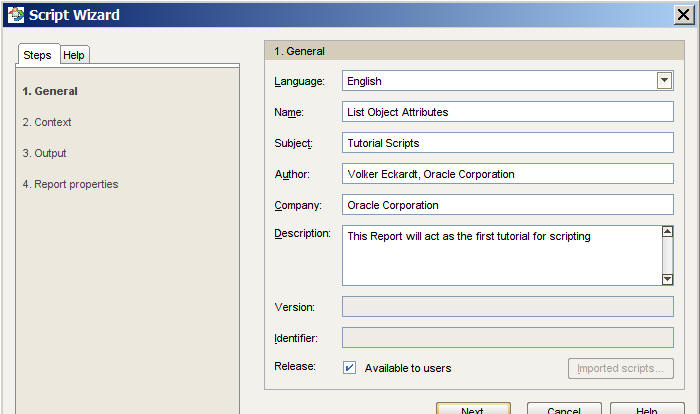
Step 4: Fill in the Values for the Report definition
Step 5: Select the objects you are going to list in the report
Here we select Events and Functions.

Step 6: Choose the default Layout
Excel is not yet supported by this report, therefore we select plain text only (PDF, ...)
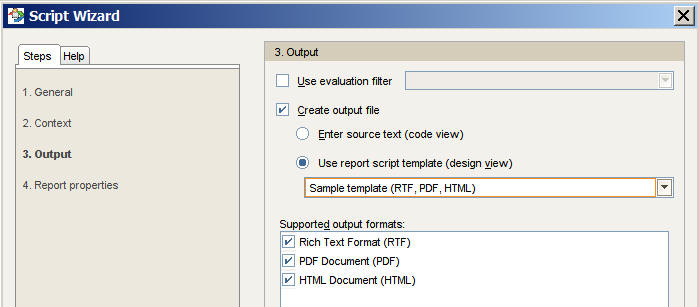
Continue with wizard step 4 and click on [OK]
Hint: If you select here "Enter source text (code view), then you can continue directly with step 9. In this case no layout will be created. Please make sure that you are selecting at least PDF as output type.
Step 7: Review the result.
The wizard assumes that you are going to create a report with layout, therfore some content data are already there, but ...
Step 8: Change to Script editor and remove the Content
... as we are going to create our own, we will remove everything.

That's the generated code:

Select everything and hit the [Delete] button.
Now press [save] and accept the warning.

Step 9: Now we are beginning to code
Usually a code starts with some constants. In this case it is a language constant (we need it to read the attribute names correctly)..jpg)
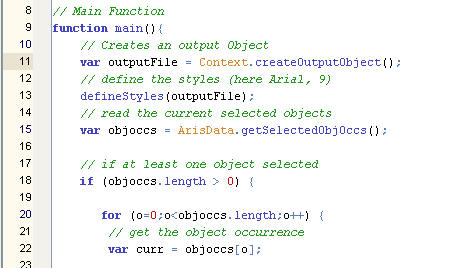
Below that we start immediately with the main function. In fact it will not be called here, but it will be defined. With the Context we define a handler for the outfile, set the format we are going to use and get a list of all selected objects.
If at least one object has been selected, we will continue and loop through this list. The current object we track in currObject.
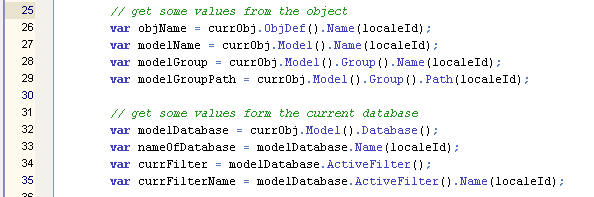
To make the report a little bit more complete, we are reading some general values like the model name, the group etc. And also the current filter.
We will now print the selected data above immediately (to be precise: prepare for printing).

And will now take care about the object attributes itself. In this first part we list only maintained attributes. A custom function will provide this information. The print out is again a list.

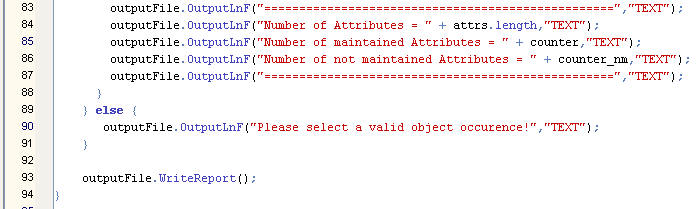
In a second part we are printing the oposite, which means all not maintained attributes. You see this small ! in front, this will do the job for us.

A little bit of summary, and a final go for the report to write.
Below the closing "}" we have some helper functions. This simple function will determine if the attribute is maintained or not.
And the second will just define an output style.
.jpg)
Because the engine does not recognize the main function automatically, we have to call it here.

How to start?
Open a model, click on one or on multiple objects in it, and select "Evaluate" > "Start Report ...". Select your report category and let it run.

Final note:
This tutorial helps you to get a better understanding how JavaScript works inside ARIS. You may find easier or better solutions to provide the same - please use this community to share your thoughts. I am going to extend this first version step by step and will make it more complete.
Any kind of feedback is very welcome!
Download
Please download the report file from here
Next Article
In the next article we are going to change the output to Excel and will discuss special enhancements to get a nicer output.
Related Articles
Best regards
Volker

.png)


Ahmad Fares on
do you have this script ?