
Hello Community,
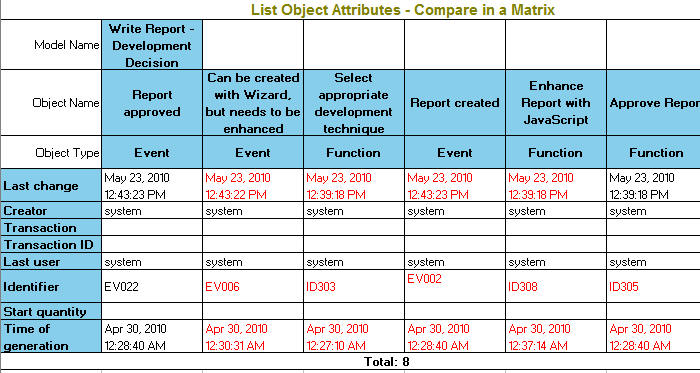
As offered I am going to leave the first report behind and will now create a new matrix report. Generally I will use some of the previously discussed solutions and techniques like code sharing, loops, drilldown in the object hierarchy, Excel output etc. But this time I will put all data into one single sheet and will use the x-axis for the attributes and the y-axis to hold my objects itself.
The speciality here is to collect all axis values in advance and make the attributes unique. By using these techniques you can create a nice matrix.
It is probably not a good idea to compare Events with Functions, but as defined you can run it like that.
The main elements again in short:
- Matrix Report with Attributes in the row and Objects in the columns
- Dynamic and Unique List of Attributes
- Dynamic List of Objects
- Model Name only when changed
- Colored changes
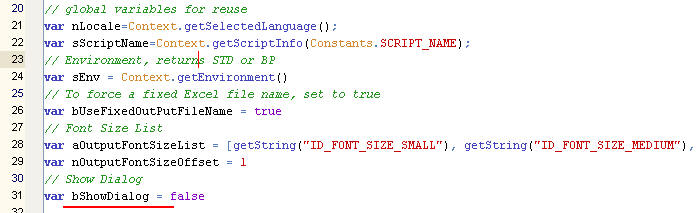
Step 1: Define Globals
As you can see there are mainly the same constants as in the other report. Only the last is new; allowing me a faster testing (in case I set ShowDialog to false).
Step 2: Start the Main
This step doesn‘t show anything new. Just again good old friends like getFixedFileName, writeHeaderAndFooter, defineStyles and if (sEnv == "STD").
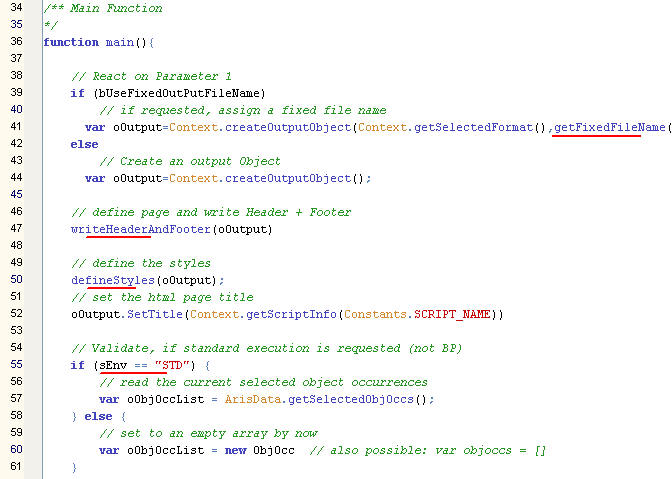
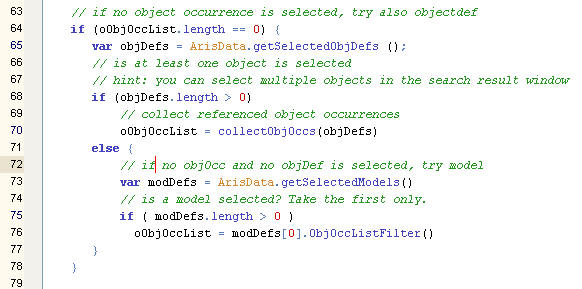
Step 3: Support Multi Select
Same to here, this procedure allows you to select a model, multiple object occurrences or object definitions when starting.
Step 4: Table Title and First Collection (Y-Axis)
Now the difference starts: We print immediately the title and collect in array #1 all object definitions from the occurrences.
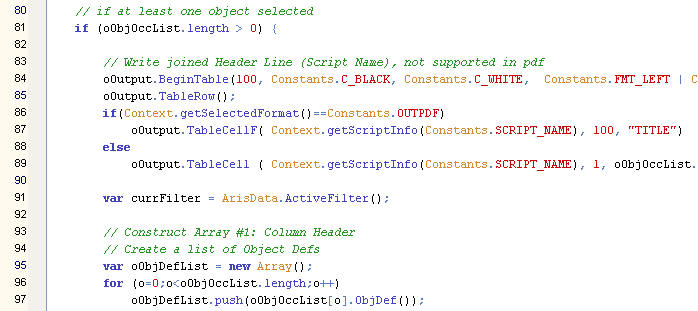
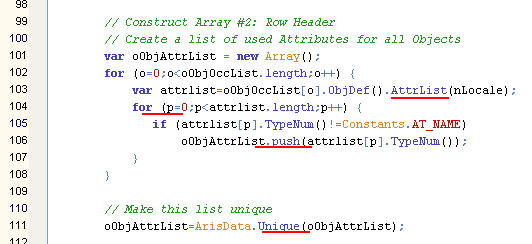
Step 5: Second Collection for the Attributes (X-Axis)
Here we read all objects with attributes and put all of them into a new array. As this array becomes our x-axis we make them unique.
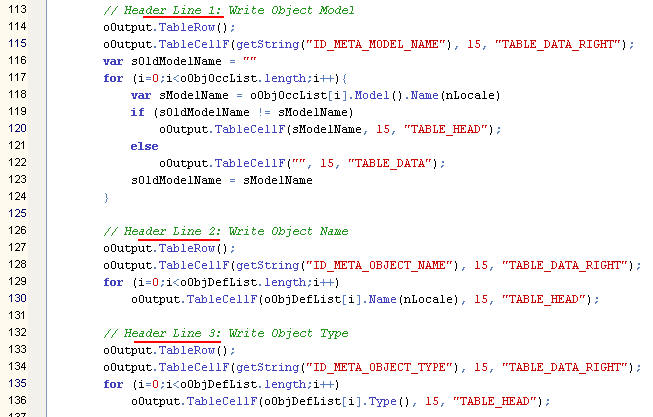
Step 6: Print the Header
In this step the three header lines will be printed. For the model name we use the technique to hide any further repeating value.
Step 7: Print the Attribute Values
This step is quite simple, where as the code seams to be complicated. First we print the Attribute Name itself, followed by all attribute values. If the value is different to the previous value, we use the red colour. In case it is the same, it comes with black. Any first value in a row will be printed as black anyway.
.jpg)
Step 8: Hide the Dialog
Right after the function header there is an added command to validate the bShowDialog global variable.

Everything else is the same.
Now you should get the layout as shown in the first picture. Try it out and play a bit with different selected objects. Concerning the output format I am supporting Excel and Html only (in case you have selected many objects the output looks much better in Excel than in html).
Summary
The described procedure allows you to create matrix reports to validate attributes across multiple objects.
Download
Please download the final report file from here.
Next Article
In the next article we will change this report by enhancing the attribute printing itself. Additionally I will offer a flexible option to create dynamic dialogs.
Related Articles
Any kind of feedback is very welcome!
Best regards, Volker