Hi,
There are a couple of things i want to do, but i don't know if it is even possible:
1. I have a pie chart but when i display it, it doesn't show all the labels (without mouse overs). Weirdly enough it shows labels of small slices but not of bigger ones, how can i control this? I want all my labels displayed at all times, if possible.
2. Can i filter data in tables like in MS Excel? Add the filter to the table itself? (not by connecting it to other charts)
3. In my pie chart i'd like to display the total amount (it currently shows number of processes and %). I think i can't do this whithin the chart, but i don't have an idea of how to display the total in a nice, little boxlike elegant way outside it. Any suggestion?

.PNG)

.PNG)

Christian Neu on
1. Would you please upload a screenshot for your first question?
2. Did you mean this?
This filter method isn't possible in MashZone. You can only filter with other components.
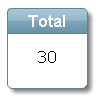
3.Your third question is easy to handle. Just create another column, for example "Total" in the data feed and insert 1 as value.
Afterwards, select your pie chart and connect Total to your KPI. Choose Sum as aggregation and click save.
Finally, the result:
Best Regards,
Christian