
MashZone 2.1 has another great new feature. It now allows users to set the colors for their graphics themselves in order to, for example, use their corporate identity (CI) colors in MashApps.
There are two ways to do this.
You can add a new, customized color palette to the preinstalled palettes. To do so, you must create an XML file and insert it into $install/assets/colorschemes.

The content of the file must look as follows:

After creating the file, it should be stored in the following folder:

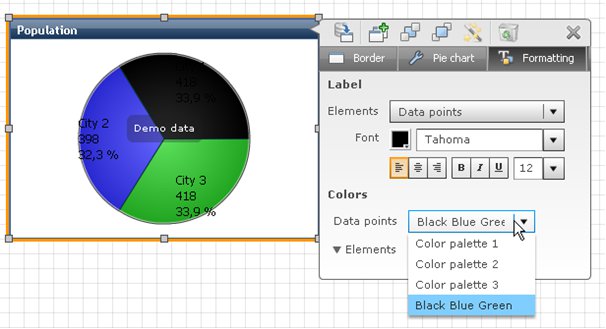
This new color palette is then available in the future for all MashApps and can be selected in the graphic options under Formatting -> Data points.
The second possibility allows you to extract the color code from the data feed and thus, color graphics directly in a MashApp. Color names or the hex codes are used to do this.
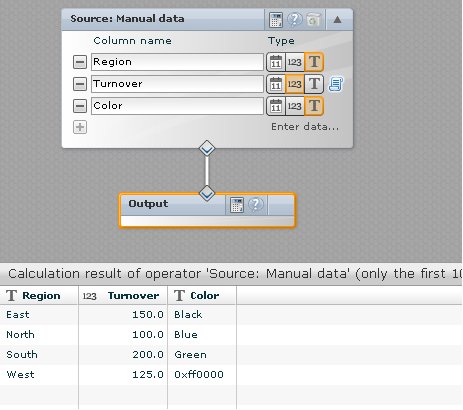
Then, you can select the customized color codes under Criterion -> Colors.

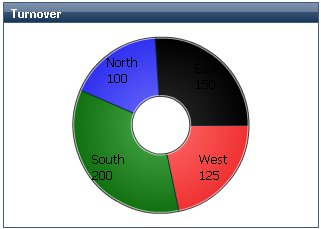
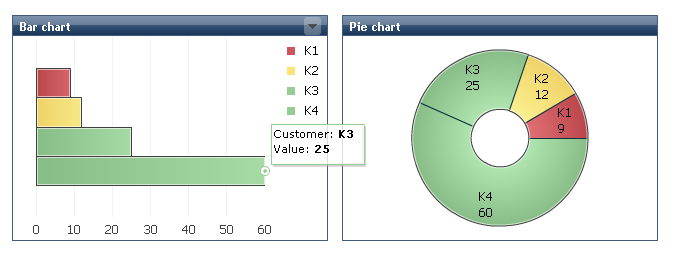
The result could for example, look like this:
Note: Make sure to also read about the other new features of MashZone 2.1!


Dieter Jansen on
Good Morning,
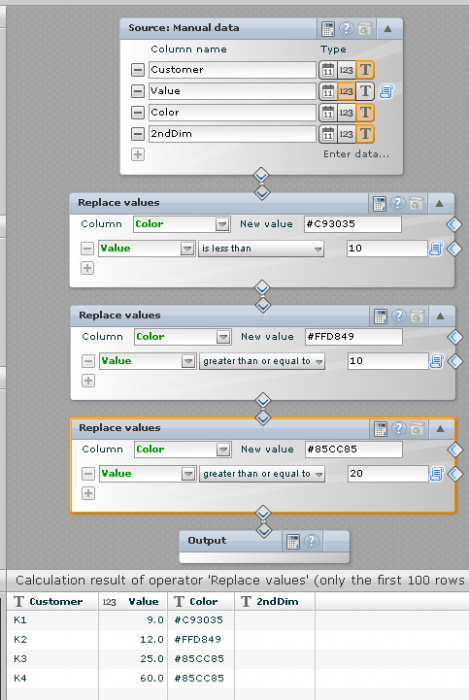
Not entirely related to the topic, but I'm wondering whether it is possible to change the colour of a single bar in a bar chart based on its value. Currently thresholds are shown in the background, but I would prefer that if a particular value is higher than the threshold value, then the bar colour itself changes. Is this possible?
Dieter