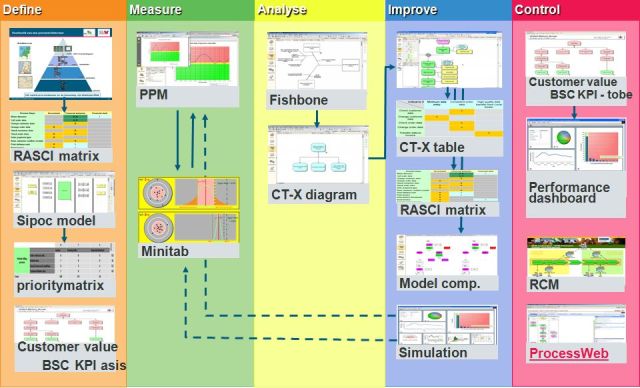
As the first two articles have explained, more and more companies are recognizing the value of Six Sigma. IDS Scheer has been actively involved in this field since July 2007, when it launched a corresponding product and service offensive. We worked closely with our customers to create ARIS Six Sigma , which offers a host of models and analysis options covering the entire DMAIC (Define-Measure-Analysis-Improve-Control) cycle (see picture below for an overview). This blog entry gives you information on how each of the five phases is supported by ARIS Six Sigma.
Establishing the project scope and objectives of a Six-Sigma initiative is a key aspect of the Define phase. The Six Sigma SIPOC model used for this purpose is supported by ARIS Six Sigma, allowing all the relevant elements of a process to be defined. The SIPOC model (supplier, input, process, output, customer) leads to the creation of a high-level process chain containing just a few key details.
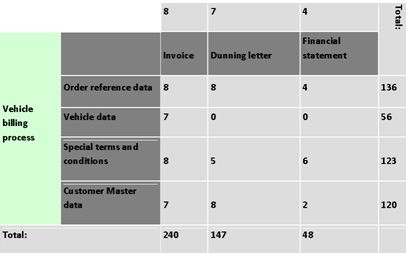
The input/output matrix is a way of evaluating the SIPOC model. It is a report that identifies the most important input and output combinations in order to achieve the defined project objectives.
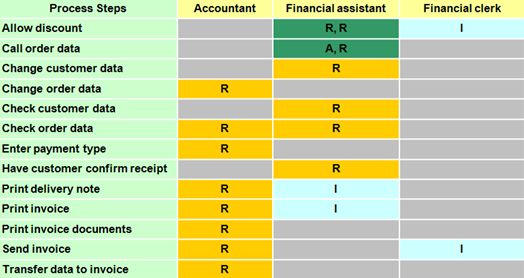
To define the SIPOC model processes in more detail, they can have an event-driven process chain (EPC) assigned to them. The main purpose of such assignments is to document each process and identify all roles that are critical to the success of the project by means of evaluations using RASCI charts.
The Measure phase involves measuring process performance in order to carry out the statistical analysis that is at the heart of the Six Sigma method. In conventional Six Sigma projects, this often requires laborious data measurement, typically only based on sampling because of the effort involved. ARIS PPM can supplement or even replace this manual procedure via automated measurement of process performance, thus delivering a complete measurement picture of all process instances. Sampling becomes a thing of the past. The measurement data can be transferred via an interface from ARIS PPM into Minitab, the standard software for Six Sigma statistics. Minitab offers statistical analysis tools, such as box plots, control charts, and process capability sixpacks, to determine the current Six Sigma values.
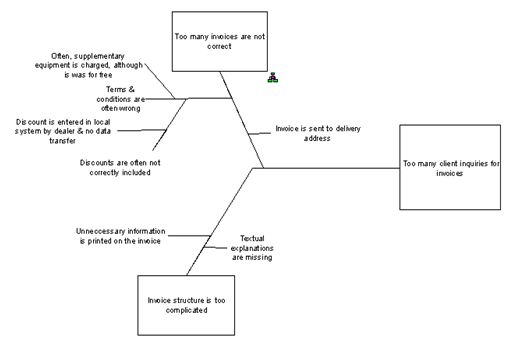
The fishbone diagram and CTX model are features of the Analysis phase. Users can utilize the fishbone diagram to model the five “why” questions, making it possible to drill down and find the root cause of a problem.
CT stands for “critical to” and refers to the critical success factors of a process. The CTX diagram transforms any issues arising during a process into critical success factors, e.g., in terms of quality, cost, and time. This allows the critical path of a given project to be identified.
The report that evaluates this model is the CTX table report, which is used in the Improve phase of the DMAIC cycle. It collects all critical factors and searches for all occurrences in the process models. The report displays a summary of the critical factors and lists individual processes that contain such factors.
The Control phase allows process quality to be displayed in ARIS Performance Dashboard based on Minitab diagrams, e.g., for process capability. Process data is automatically measured, which ensures that the diagrams are completely up-to-date. This continuous data monitoring also provides process owners with valuable insights.
As this article described, the available ARIS products and services cover the entire DMAIC cycle. Intuitive visualizations facilitate improved communication and boost the knowledge level of employees engaged in a Six Sigma project. Automation (PPM) lowers costs and shortens project duration, while integration of Minitab results in the company dashboard means that data is always up-to-date (e.g., control charts).



.jpg)


Sadiq AL-Shara on
Thank you so much for the incisive article.
Assuming we have a SIPOC model in ARIS Business Architect, with its process (function object) having an EPC model assigned to it, and we needed to define the suppliers, inputs, outputs, and customers based on the assigned EPC:
How can we represent the documents used in the EPC as SIPOC inputs and/or outputs if the SIPOC model in ARIS Business Architect does not include information carrier objects?
Would the SIPOC supplier be only the first position used in the EPC or all the positions used in the EPC that contribute to supplying the output of the EPC? And in both cases, would the respective position itself be used as a supplier in the SIPOC model or the organizational unit that is composed of the respective position?
Can an external person be a SIPOC supplier (i.e. a customer filling an application form for a certain service)?
Assuming the above questions are invalid due to the fact that SIPOC modeling is performed on higher levels of a process view, then what is the point of assigning and EPC to a SIPOC process (Function object) in ARIS Business Architect if the EPC’s content is not to be reflected in the SIPOC model itself?
Thank you in advance.