Profile picture for user Eva Klein

The WYSIWYG editor is a practical means of creating reports. In my last article, I explained the difference between using the WYSIWYG editor to create a script and directly programming it using JavaScript code. In this article, I focus on the overall structure of WYSIWYG editor.

In the WYSIWYG editor you can define the content and layout of your reports based on report script templates. The templates provide sections and subsections, headers and footers, and an optional cover page. You can add various elements to these structural elements, such as queries, data fields, data tables, text boxes, formatting tables, text, images, charts, or hyperlinks. Formatting tables are available that you can use to place and arrange the relevant elements in sections and lines.

Report script templates provide a schematic representation of the report's content and layout, with individual placeholders being inserted for query components such as data fields, data tables or charts. When the report script is run, the corresponding data is inserted and later displayed in the final report.

Example: Structure of a report script template

Structure

The WYSIWYG editor is structured into two columns. The 'Structure' column on the left shows the hierarchical structure of queries. The 'Content' column on the right contains the display and layout components that were inserted.

Sections

The basic structural elements of report script templates are called 'sections'. In these sections the data to be evaluated is defined by means of queries, and layout components such as headings or images are inserted.

Example: Section

In a section you can define that only the EPCs of a selected group are queried. The data of these EPCs then serves as the basis for other queries, for example, a query returning all functions of the relevant EPCs or their names.

Context

When creating a report, you first select the context (e.g., groups or models) and thus define the database items for which a report can be run. For each selected context, a corresponding section is automatically created on the highest level of the report structure, into which queries can be inserted subsequently.

Example: Context

If 'Database' was defined as the context of the section on the highest level of the structure, you can run the report for selected databases. If a second section has 'Group' as its context, it is possible to run the report also for selected groups. If the report is run directly for a group, no queries are run for a database.

Repetition area and static area

A section consists of a repetition area (highlighted in dark beige in the screenshot above) and two static areas (highlighted in light beige). The static areas are positioned above and below the repetition area. If no data is available for the section's repetition area, only one static area is displayed. You can insert any required content in the individual areas. The contents of static areas is output only once when report script templates are run, while the content of a repetition area is output as many times as a query returns data elements.

Example: Query in the static area

In the static area, you can display the name of a database. The name is displayed in the report once.

Example: Query in the repetition area

In the repetition area, you can query all functions of multiple EPCs. The report outputs the function names individually.

Subsections

Subsections serve to supplement and nest queries.

Example: Nesting queries

The context of a section on the highest level of the report structure specifies that the query can be run for selected groups. In a section that is inserted, only EPCs of selected groups are queried. In another subsection, all functions of EPCs contained in selected groups are queried. Furthermore, the names of the functions are output using a data field. The report lists all names of the queried functions for each EPC of a group.

Levels of the report structure

A report script template can contain any required number of sections. A section or subsection can contain as many subsections on the same level as you need. In the report structure you can define a maximum of six levels. Within a section, subsections are indented.

Headers and footers

On the report pages, content can be displayed in headers and footers. Sections can also have their own headers and footers, which then replace headers and footers of the report pages. It is not possible to insert queries in a header or footer. In the report definition, headers and footers of a page are highlighted in gray.


Creating a report using the WYSIWYG editor is therefore just a matter of filling the different sections and sub-sections with the required data. In my next article, I will walk through a simple example report.

by Nikhil Tayade
Posted on Thu, 09/08/2011 - 13:16

Hi Eva,


Thanks a lot. this was really very helpful. However I am right now looking for a Report that contains Model Name, Model Type, Time of Generation and Last Change data for one entire Group.

I tried to use the concept explained above. but unfortunately while workin on the report, i could not find the Last Change & Time of generation as a Filterable by Type items.

Can you please help me out with this?

0
by Eva Klein
Badge for 'Community Team' achievement
Author
Posted on Mon, 09/12/2011 - 09:21

Hi Nikhil,

you can get the values of these attributes via "filterable by type" method.

Insert the corresponding data fields.

Select the Attribute value item under Attribute (filterable by type) and click on the Next button.

Now, you can select the Attribute type Time of Generation and click on Finish.

You can insert the attribute value of "Last change" in the same way.

The report should look as follows:

Add model attributes to report

I hope this will help you. If you have further questions please feel free to ask me.

0
by Adriana Pinto
Posted on Tue, 08/06/2013 - 20:19

In reply to by Frank Weyand

Hello,

how could I use a data field in cover page, in order to generate this automatically for each model I'd like to report.

For example, writing the name of the model in the cover page, but automatically.

Thanks...

Adri

0
by Nikhil Tayade
Posted on Tue, 09/13/2011 - 11:58

Hi Eva,

Thanks a lot for the reply.

I tried this, But when I pressed the Run Button, I got the message as "Debugging is Not Active" and then nothing happened. I didnt get any report output.


Am I doing the right thing while 'Running' the report.


Please can you help me out in this?

0
by Dušan Šamudovský
Posted on Tue, 10/18/2011 - 15:31

Hi Eva,


I experience similar problem as Mr. Nikhil Tayade the report runs OK and some of the object attributes I need do fill in the report (name, description, cost etc.), but some like average procesing time or procesing time for function don't. (and they are not blank) Is it a wysiwyg bug with some attribute types or?

thanks

Dusan

0
by Eva Klein
Badge for 'Community Team' achievement
Author
Posted on Wed, 10/19/2011 - 13:07

Hi Dusan,

No, the report above only shows the attributes of the selected models, not their functions and other objects. To get information about objects you need to add a new subsection. A description of how this works is available in this tutorial: "WYSIWYG tutorial: Insert attribute list as a data table".

I hope this will help you.

0
by Dušan Šamudovský
Posted on Wed, 10/19/2011 - 16:08

Hi Eva,


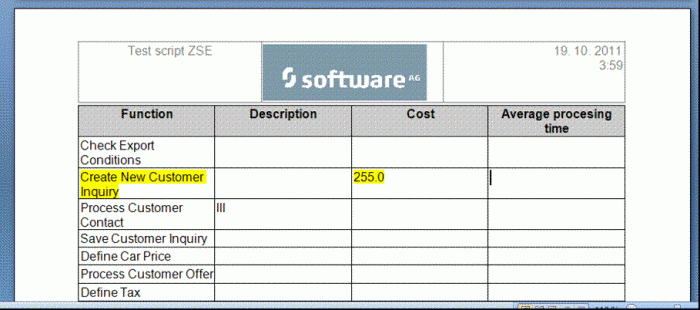
Thanks for link. I did insert attribute list as a data table for function. What I ask is why some of the object attributes don't fill in the report - namely average processing time or procesing time for function are blank in the report although they are mantained in the functions of the ECP.  I can't figure out the reason. Below see what I mean.

EPC with function attributes (including average processing time)

Script with insert attribute list as a data table for function (checked several times weather I inserted the corret attributes because some work and some don't...)

Report with blank average processing time for the function showed above with filled in attribute average processing time: 20 sec.

many thanks

Dusan

PS: any hint on how to insert contents once I deleted it from the script structure?


0
by Eva Klein
Badge for 'Community Team' achievement
Author
Posted on Thu, 10/20/2011 - 09:13

Hi Dusan,


I have probably  solved your problem:-).   In the first try I had the same problem like you. I think you have selected the wrong attribute for Average processing time.   Here is the solution of your problem:

1. Select the attribute type "Avg. Processing time" (not Average Processing time)

2. How you can see  is my report structure is the same like yours

report structure

3. My output with the new attribute shows the values

Output of average processing time

I hope this will help you.

0
by Dave Runyan
Posted on Wed, 06/12/2013 - 19:14

Eva, I am just starting to explore the WSIWYG reporting, but one thing I found confusing: you differentiate between the scripting reporting and the WSIWYG in your intro, but then you use the word "script" in title of this next article, but not the word "WSIWYG".  I was not sure looking at the intro what article I should read.

Feel free to delete this comment, as it is intended only as a suggestion to you.

0
by Poh Chuan Fong
Posted on Wed, 08/28/2013 - 03:42

HI Eva, I am looking to set an image in one tab and a table in another tab in excel. Is there any way the WYSIWYG can perform this? Thanks.

0
by Akhror Akbarov
Posted on Thu, 06/25/2015 - 16:17

Hi Eva,

It's very useful posts, I just started discovering WISIWIG and need video tutorials, any chance that you have any?

Best Regards,

Akhror

0
by Akhror Akbarov
Posted on Thu, 06/25/2015 - 16:19

I use ARIS 9.8

Thanks

0

Featured achievement

Rookie
Say hello to the ARIS Community! Personalize your community experience by following forums or tags, liking a post or uploading a profile picture.
Recent Unlocks

Leaderboard

|
icon-arrow-down icon-arrow-cerulean-left icon-arrow-cerulean-right icon-arrow-down icon-arrow-left icon-arrow-right icon-arrow icon-back icon-close icon-comments icon-correct-answer icon-tick icon-download icon-facebook icon-flag icon-google-plus icon-hamburger icon-in icon-info icon-instagram icon-login-true icon-login icon-mail-notification icon-mail icon-mortarboard icon-newsletter icon-notification icon-pinterest icon-plus icon-rss icon-search icon-share icon-shield icon-snapchat icon-star icon-tutorials icon-twitter icon-universities icon-videos icon-views icon-whatsapp icon-xing icon-youtube icon-jobs icon-heart icon-heart2 aris-express bpm-glossary help-intro help-design Process_Mining_Icon help-publishing help-administration help-dashboarding help-archive help-risk icon-knowledge icon-question icon-events icon-message icon-more icon-pencil forum-icon icon-lock