Hello
I wrote a query that starts with a group containing BPMN process models. The query looks for every model contained in the group and all its subgroups and displays the combination of (data, roles) where the roles are performing activities that have data as outputs.
Here is the query graph a and the spreadsheet structure (the query looks in every subgroup for bpmn models, then for every model looks for cluster data object, then for function having these objects as output, then for roles performing these functions)
.PNG)
The trouble is the results are not displayed in two columns but in a series of two columns : one for the first group level (columns A,B in the screenshot below) , another one for the first subgroup (columns C,D) and so on : (the names of actual roles and data are blanked out)
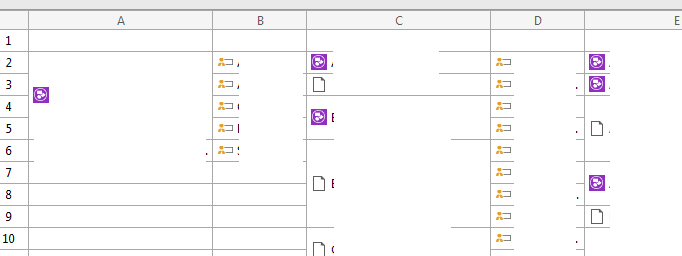
Is there a way to group all the query results in only two columns?
Thanks !
Regards
MB
Radomir Kubala on
Hello Michel Bénard,
At the moment, there is no way to group it in two columns.
BR
Rado