

Hello ARIS Community
Since ARIS dashboards were introduced with ARIS 10 the most common question was
“What makes ARIS dashboards unique – why do ARIS dashboards matter for me?”
The answer is simple – standard content and the power of context.
Utilizing standard out-of-the box use cases for dashboards offers you significant advantages, including reduced time to value, reusability and easy customizability.
Not only you can tailor dashboards to your needs, but you can also mash up the underlying data feeds with additional data by reusing existing ARIS Reports any kind of available APIs (Risk and Compliance manager, ARIS, ARIS Process Mining) or relational Databases (JDBC) in your data ecosystem.
Context, on the other hand, imparts authority to data, allowing you to believe in the information and use it to make meaningful changes.
All your ARIS dashboards can be rolled out as templates and provide all the information you need (it’s context-sensitive) at the right place (in the ARIS portal, next to your model, based on an object) for the right stakeholders (management, process owners, etc).
Insights derived from the dashboards can be easily shared and used as a starting point for your process transformation project, whether via starting a governance process or starting a collaboration discussion. Finally, ARIS dashboards can be used to bring users to the right content the first time.
Brief overview of ARIS dashboard standard use cases
- Center of Excellence (CoE) Dashboards provide comprehensive analytics and insights into the performance of a specialized center within an organization. It visualizes essential metrics related to project success, resource utilization, knowledge sharing, and the implementation of best practices, enabling the tracking of impact and effectiveness.
- Strategy Dashboards are designed to visualize key performance indicators and metrics tied to an organization's strategic objectives. They allow stakeholders to monitor progress, track milestones, and evaluate the effectiveness of strategic initiatives in real-time.
- Business Usage (Matomo) Dashboards enable the monitoring of anonymized user behaviour at both process and group levels. The inclusion of keyword search functionality drives the need for transformation, providing valuable insights into user interactions.
- Risk & Compliance Dashboards help organizations monitor and manage risk and compliance functions. They integrate data from various sources, such as regulations, policies, and risk assessments, offering real-time insights that allow stakeholders to identify risks, track regulatory changes, and ensure policy adherence.
- Customer Experience (CXM) Dashboards delivers actionable insights to enhance customer experience strategies. Businesses can track trends, pinpoint areas for improvement, and make informed decisions to optimize the customer journey.
- Variant Management Dashboards facilitate the efficient and cost-effective rollout of changes from the master model to various variants. Master owners can easily monitor the progress of the master variant rollout, while variant owners can track the rollout of their specific variants.
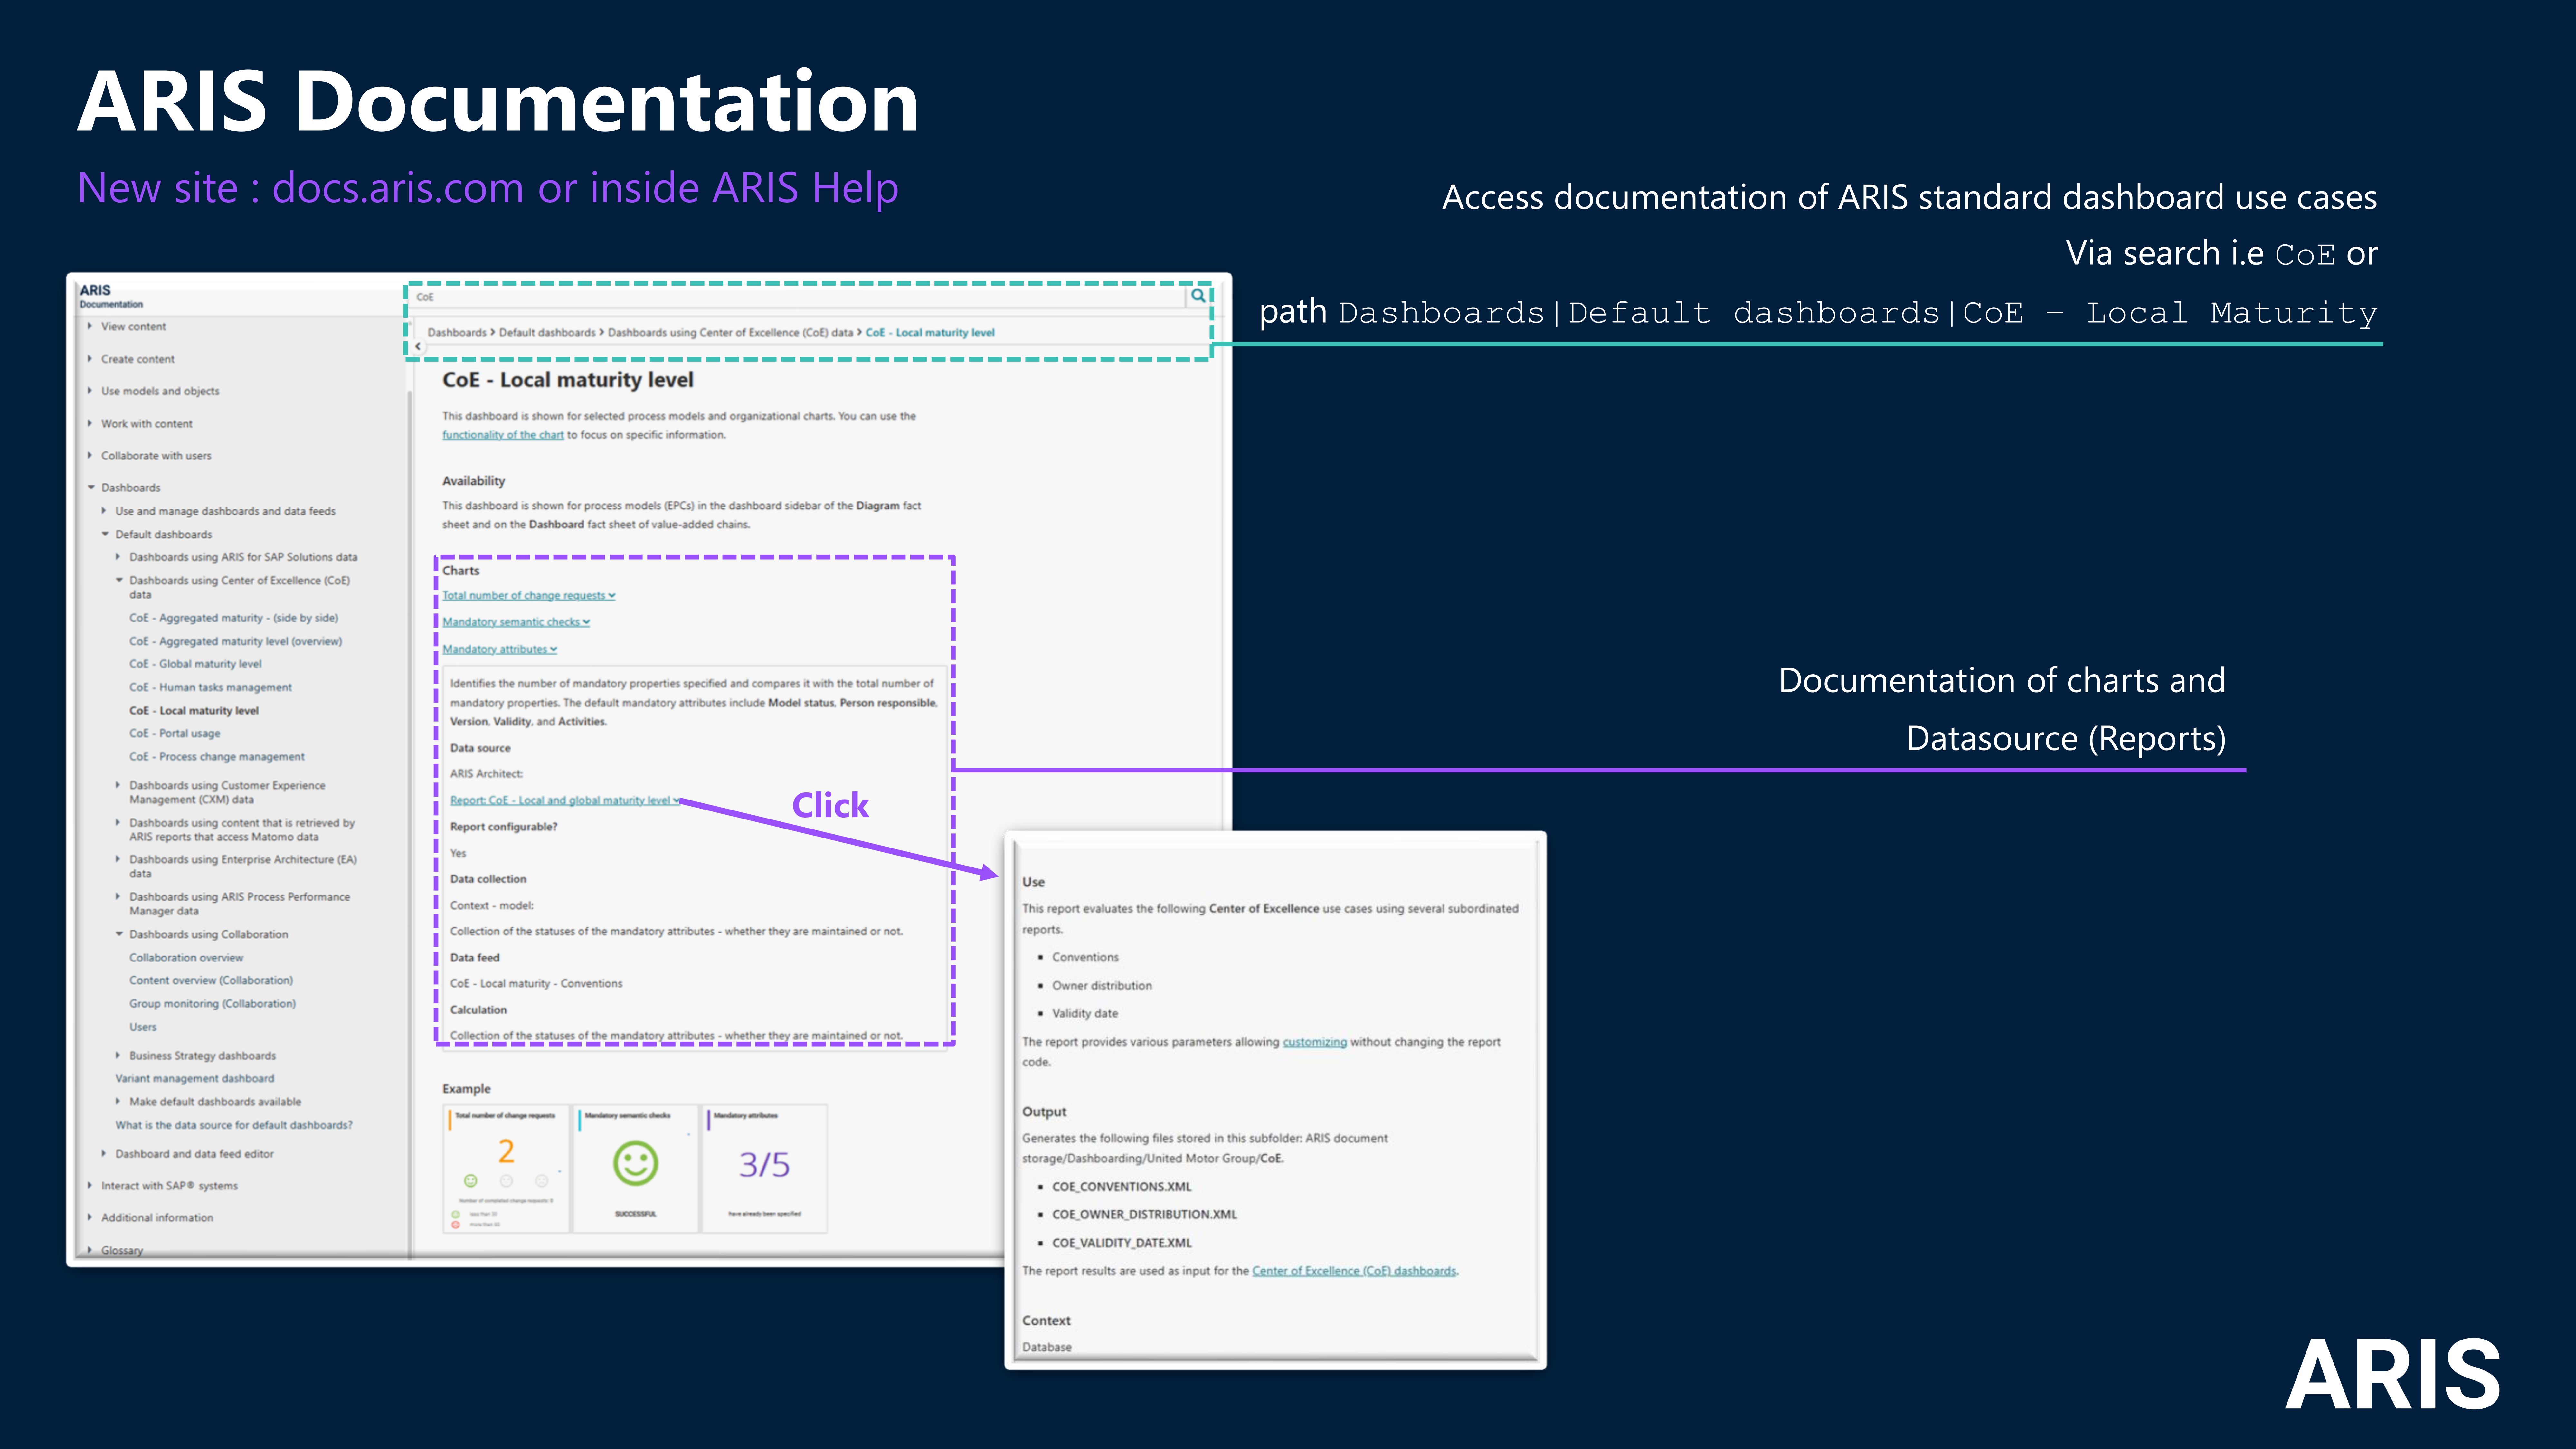
These dashboard use cases (including charts and datasources) are completely documented in the ARIS Documentation.
For todays blog we have chosen the first use case Center of Excellence (CoE).
Center of Excellence Dashboards
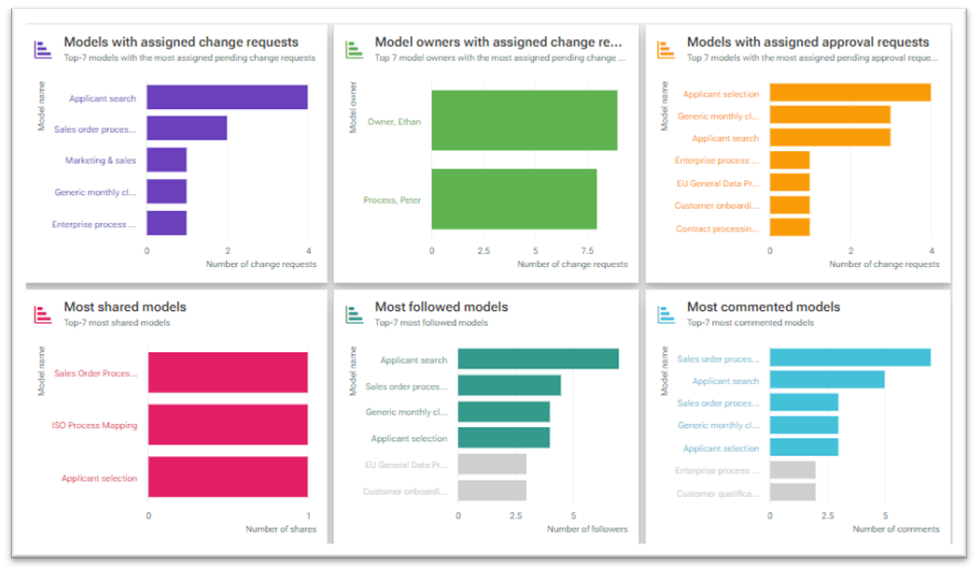
In today's fast-paced business environment, driving process transformation is crucial for staying competitive. As an ARIS expert working in a Center of Excellence, you understand the importance of having a clear overview of your process maturity. This includes knowing which processes are used, liked, shared, outdated, and changed. Fortunately, ARIS provides free-of-charge, out-of-the-box dashboards that offer valuable insights and analytics to empower you to achieve your transformation goals.
ARIS dashboards can be published standalone or in context of an item (model, group, object). You can publish them on factsheets (e.g chain, process, risk) or for dedicated models (via the GUID of the model) and assign access rights effortlessly to ensure data security and privacy. Additionally, dashboards can be also used as templates by using the GUID of the model or of the selected object to filter the analysis to the model / object relevant data.
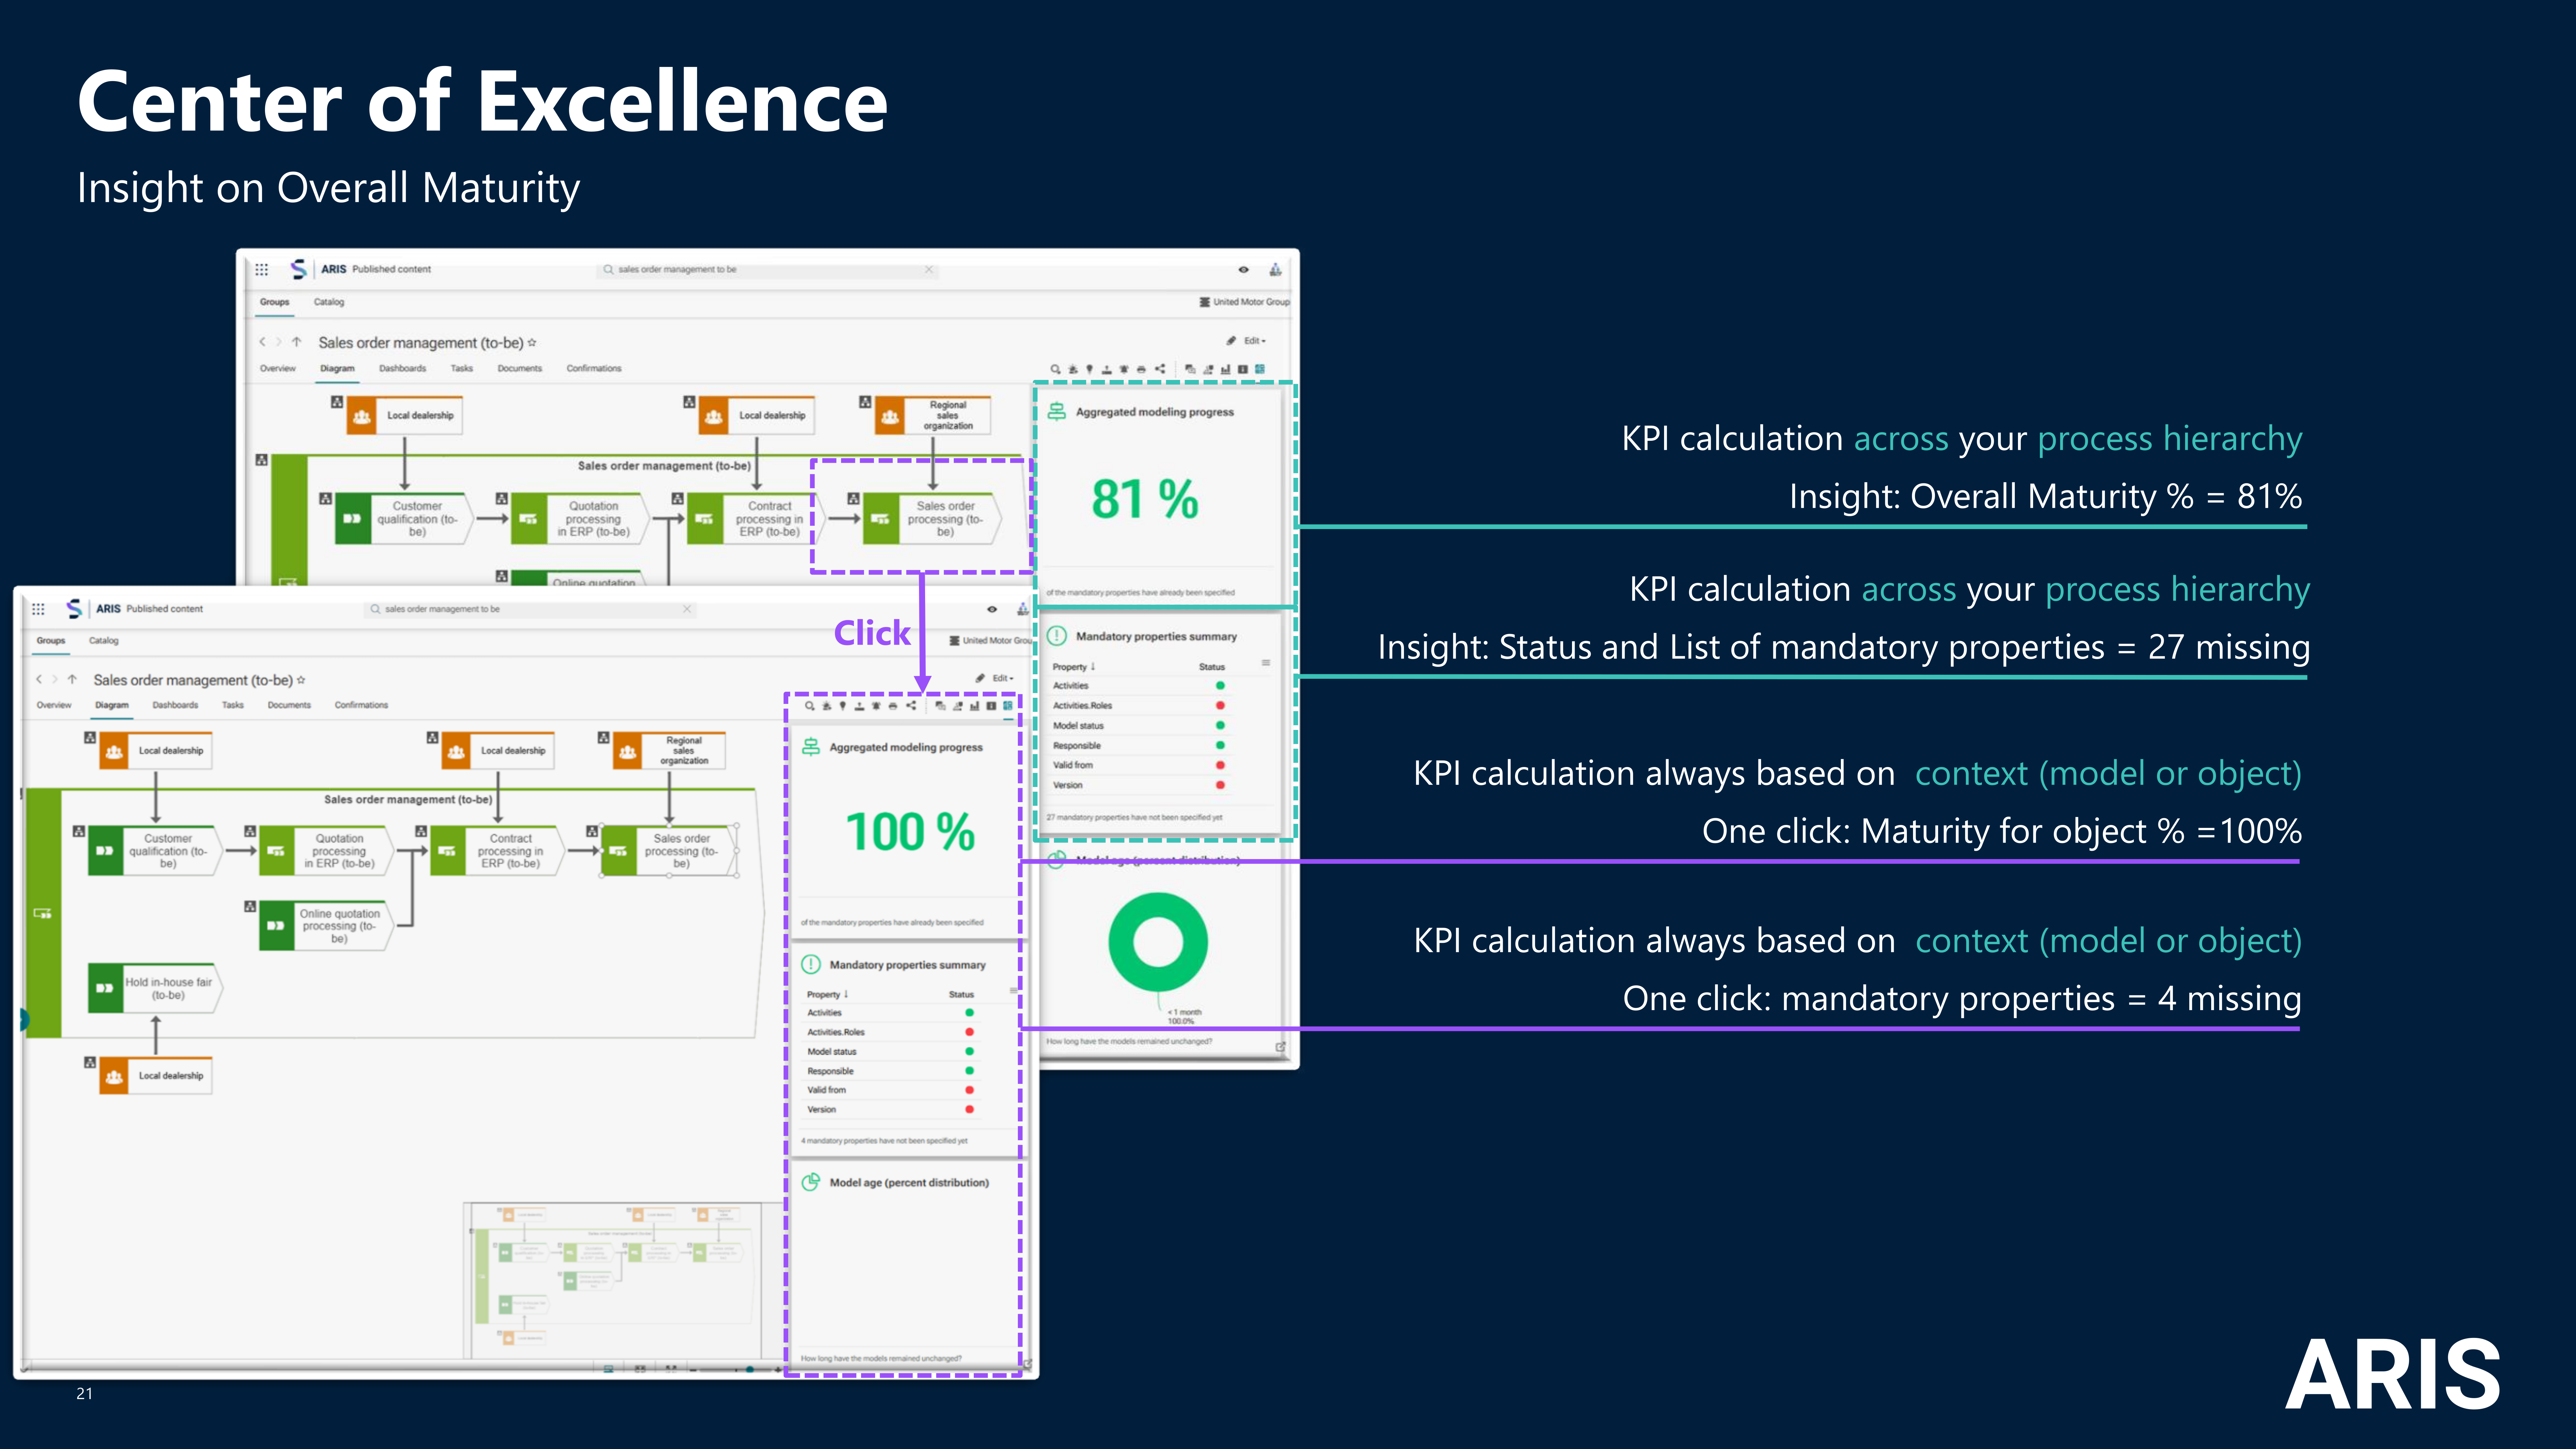
Insight and Action on overall maturity
For analysing and improving your process maturity for the CoE, two dashboards have been implemented and published to support our common use case pattern insight (on maturity) to action (to improve the maturity).
- CoE Aggregated Maturity Level for Value added Chain diagrams (VACD)
- CoE Local Maturity Level for EPC/E-BPMN diagrams
The first dashboard shows an aggregated view of all process models based on your process hierarchy in your ARIS Portal (from VACD -> EPC4/BPMN4). We can easily see that the overall maturity is 81 %, and that we have issues with assigned roles and validity dates. Overall, 27 mandatory attributes are missing.
With just one click on the desired object (e.g. Sales order processing (to-be)) all your KPIs get automatically recalculated based on your selection.
The maturity level can be easily analyzed on aggregated View (VACD).
The cause (e.g. a role not being assigned to an activity) can be further analyzed and easily corrected in the underlying model.
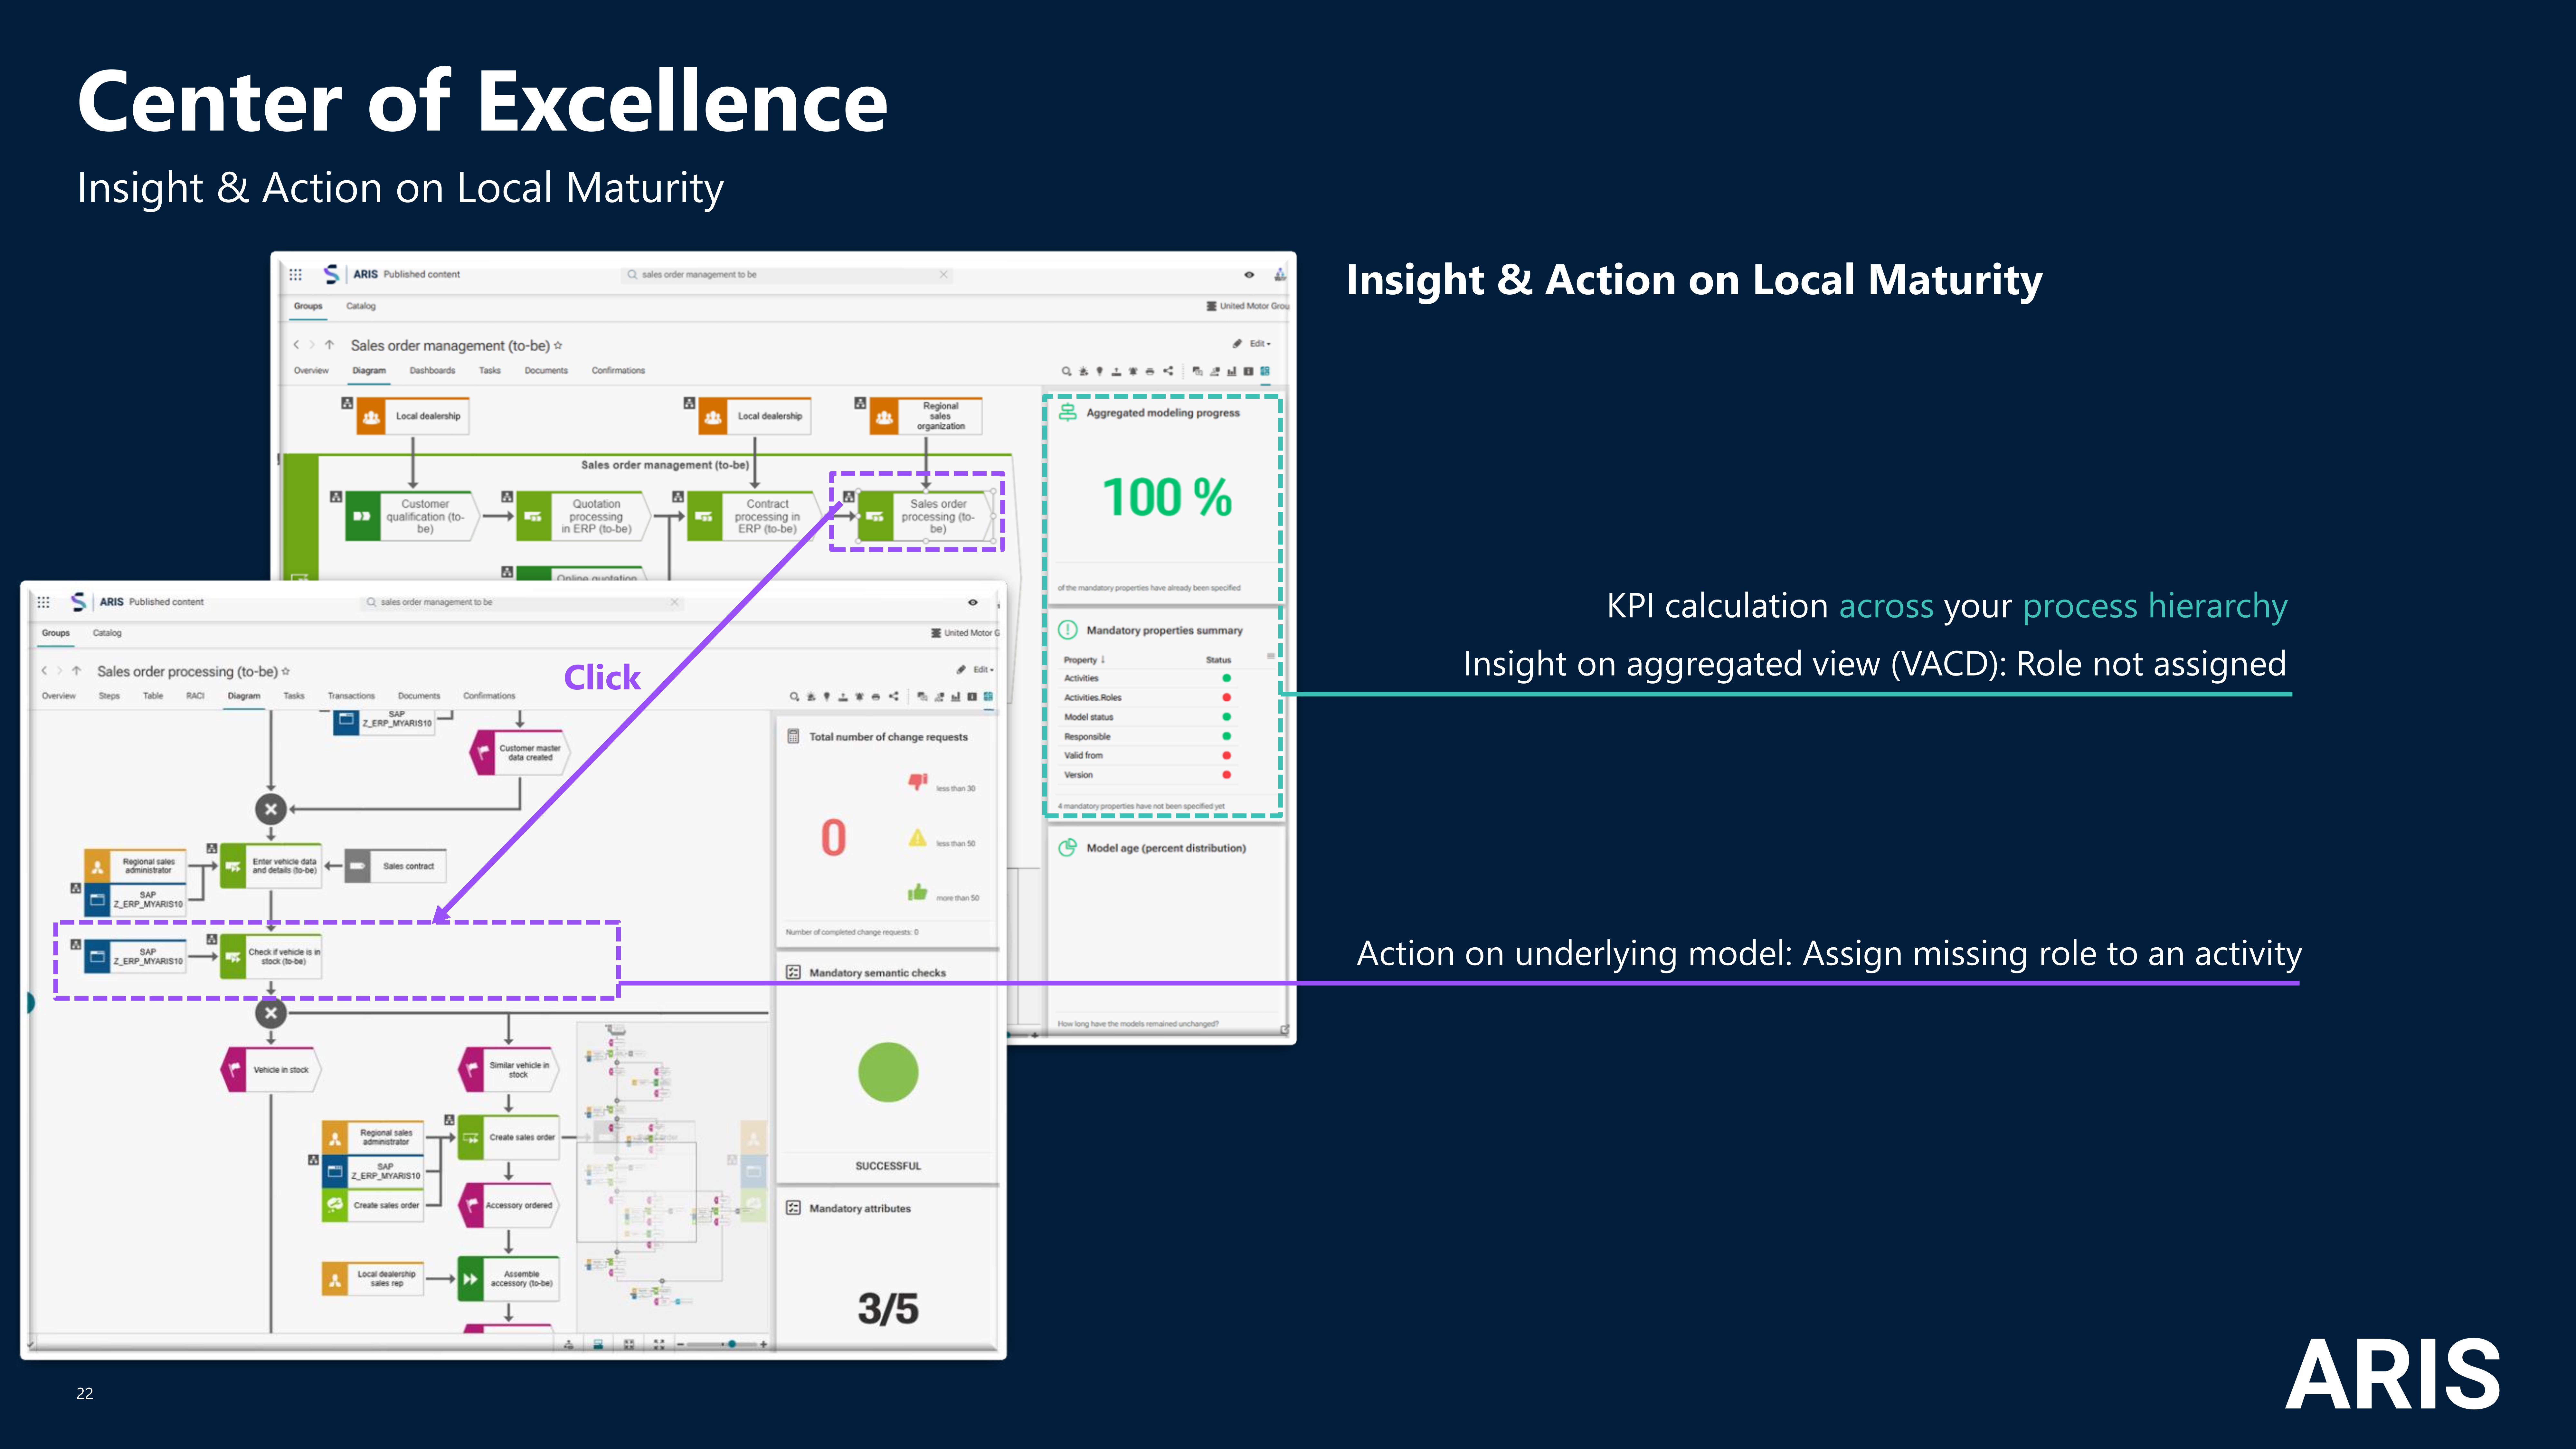
These analytics applies for all value added chain and process models (EPC,(E)BPMN) within all databases you have chosen in the publication.
With ARIS, you can define the context of your dashboard at various levels: tenant, database, context (model), and selected object.
This is where context-sensitivity really saves time and keeps the number of dashboards you need to the absolute minimum! ARIS is the only platform in the world that offers this level of context sensitivity, ensuring you get the most out of your data by being able to “re-use” your dashboards.
Data preparation
The data for these dashboards is created
- context sensitive
- per ARIS database
- certain item types (i.e chain, process)
- several model attributes
- fetched via predefined, scheduled ARIS Reports (CoE - Aggregated maturity level, and CoE - Local and global maturity level) and
- uploaded to the ARIS Document Storage server (located at: ARIS document storage|Dashboarding|<ARIS database_name>|CoE) as files to use for these dashboards.
This data can of course be leveraged with other existing data in your data ecosystem (inside and outside of ARIS) to tailor this standard use case to your needs.
Our dashboard blog topics
- Standard use cases and how to adjust them to your needs
- Guidelines on how to build your very own dashboard use cases from your business questions, including hints on data visualization techniques and guidelines how to design and optimize data feeds
- Blogs regarding your shared customer use cases
Here is the deal: You provide the question and sufficient detail, so that we can provide meaningful advice. In exchange we will provide the desired information via a blog post.
That's a wrap for today's tech talk on ARIS dashboarding!
See you soon, and remember context enables you to trust the information, leverage it to drive meaningful changes and saves you a lot of time.
Monika (20+years experience in BI/Mining/Transformation) & Helmut (Dashboarding developer since 2009)
P.S. Access to free self-paced training ARIS Dashboard Basic, ARIS documentation has moved to docs.aris.com
P.P.S. We are thrilled with the feedback we've received so far and are eager to hear more about how you're using ARIS dashboards! Feel free to share your use cases or use case related questions in either English or German. Your insights are invaluable to us!
Veronika Ellermann on
Great insights! Thanks a lot, Monika & Helmut :)
Could you share where to find the standard dashboards & data feeds?