

Hello ARIS Community,
Ever wonder how closely aligned your desktop procedures are with your blueprints?
Or how well you're covering your risks with appropriate controls?
How about strategic alignment?
Or transformation project progress?
Do business questions keep you up at night?
You need information at your fingertips, and ARIS dashboards bring you closer to your data - in the context of your process and architecture!
For todays blog we will focus on following Business Case
👥<STAKEHOLDER> As a Compliance or Process Manager,
🔍 <WHAT> I need to identify my critical processes, evaluate their maturity levels, and
🚀 <ACTION>monitor improvements
🏆 <VALUE>to ensure audit readiness, compliance, business continuity and efficiency.
We want to streamline the identification and evaluation of critical processes, making it easier to monitor necessary improvements by utilizing ARIS dashboards to visualize and analyze process criticality, their maturity levels, and ownership to ensure business continuity.
We want to take business relevant (governance) actions to ensure and improve process maturity to ultimately support audit readiness.
Accomplished by providing this data to an auditor in an easily usable format, it significantly enhances the efficiency and effectiveness of the audit process.
How to build a dashboard use case
After setting the scope dashboard creation follows generally the following 4 step process
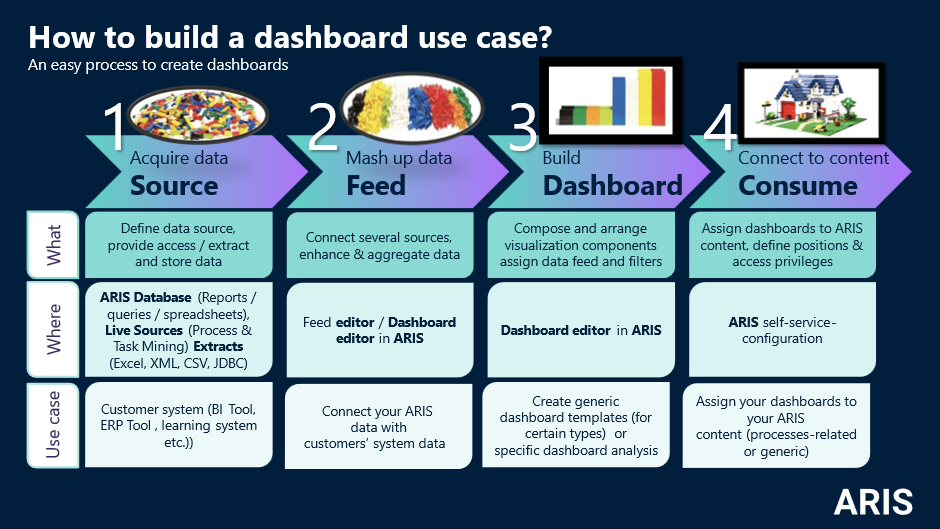
1. Acquire data source
Basically you can use all data you have already in your ARIS environment (BPA, APM, GRC, TM) or external data via different means. From simple file extracts (CSV, XLSX, XML), Databases (JDBC), APIs (JSON, GET) and live Sources like Process Mining, Task Mining, Risk& Compliance Manager. With the next service release ARIS 10 SR28 ARIS Process Mining and the Repository search are added as datasources. Leave us a comment if you have already use cases in mind for one of the following blogs.
We would need the following data populated, which is already available as attributes in your ARIS repository.
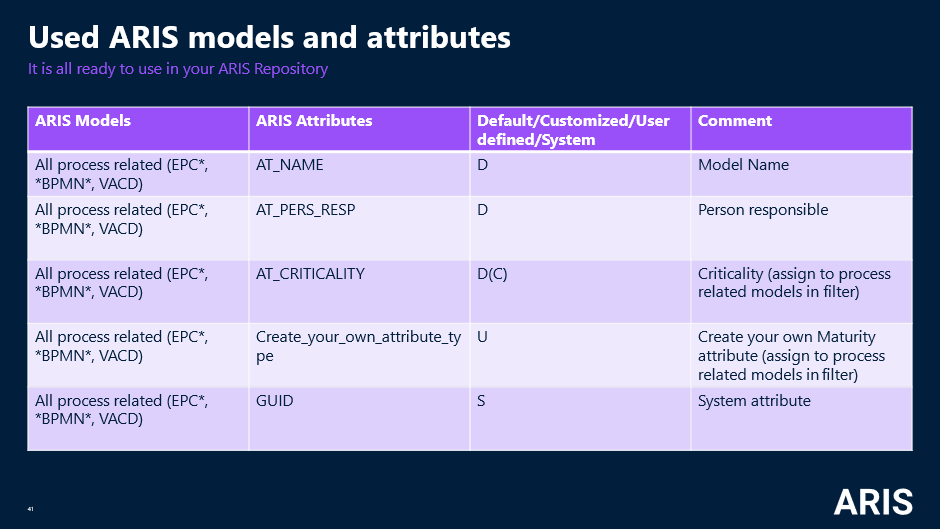
Criticality indicates the potential damage if a process fails or is improperly executed, highlighting issues. It helps prioritize damage prevention, ensuring robust risk management and safeguarding stakeholder interests.
Process Maturity level, defined in various ways ranging from how well a process is documented and used, how frequently it is reviewed, whether it has a process owner, etc, is crucial for developing and optimizing business operations. It enables objective process assessment, tracks development trends, and aids in process control. High maturity models deliver significant customer value, stable results, and easy implementation.
In a nutshell processes with higher criticality need a higher maturity but the rules for assessing/calculation of criticality and maturity can be easily tailored/optimized to your company needs/policies regarding the business impact.
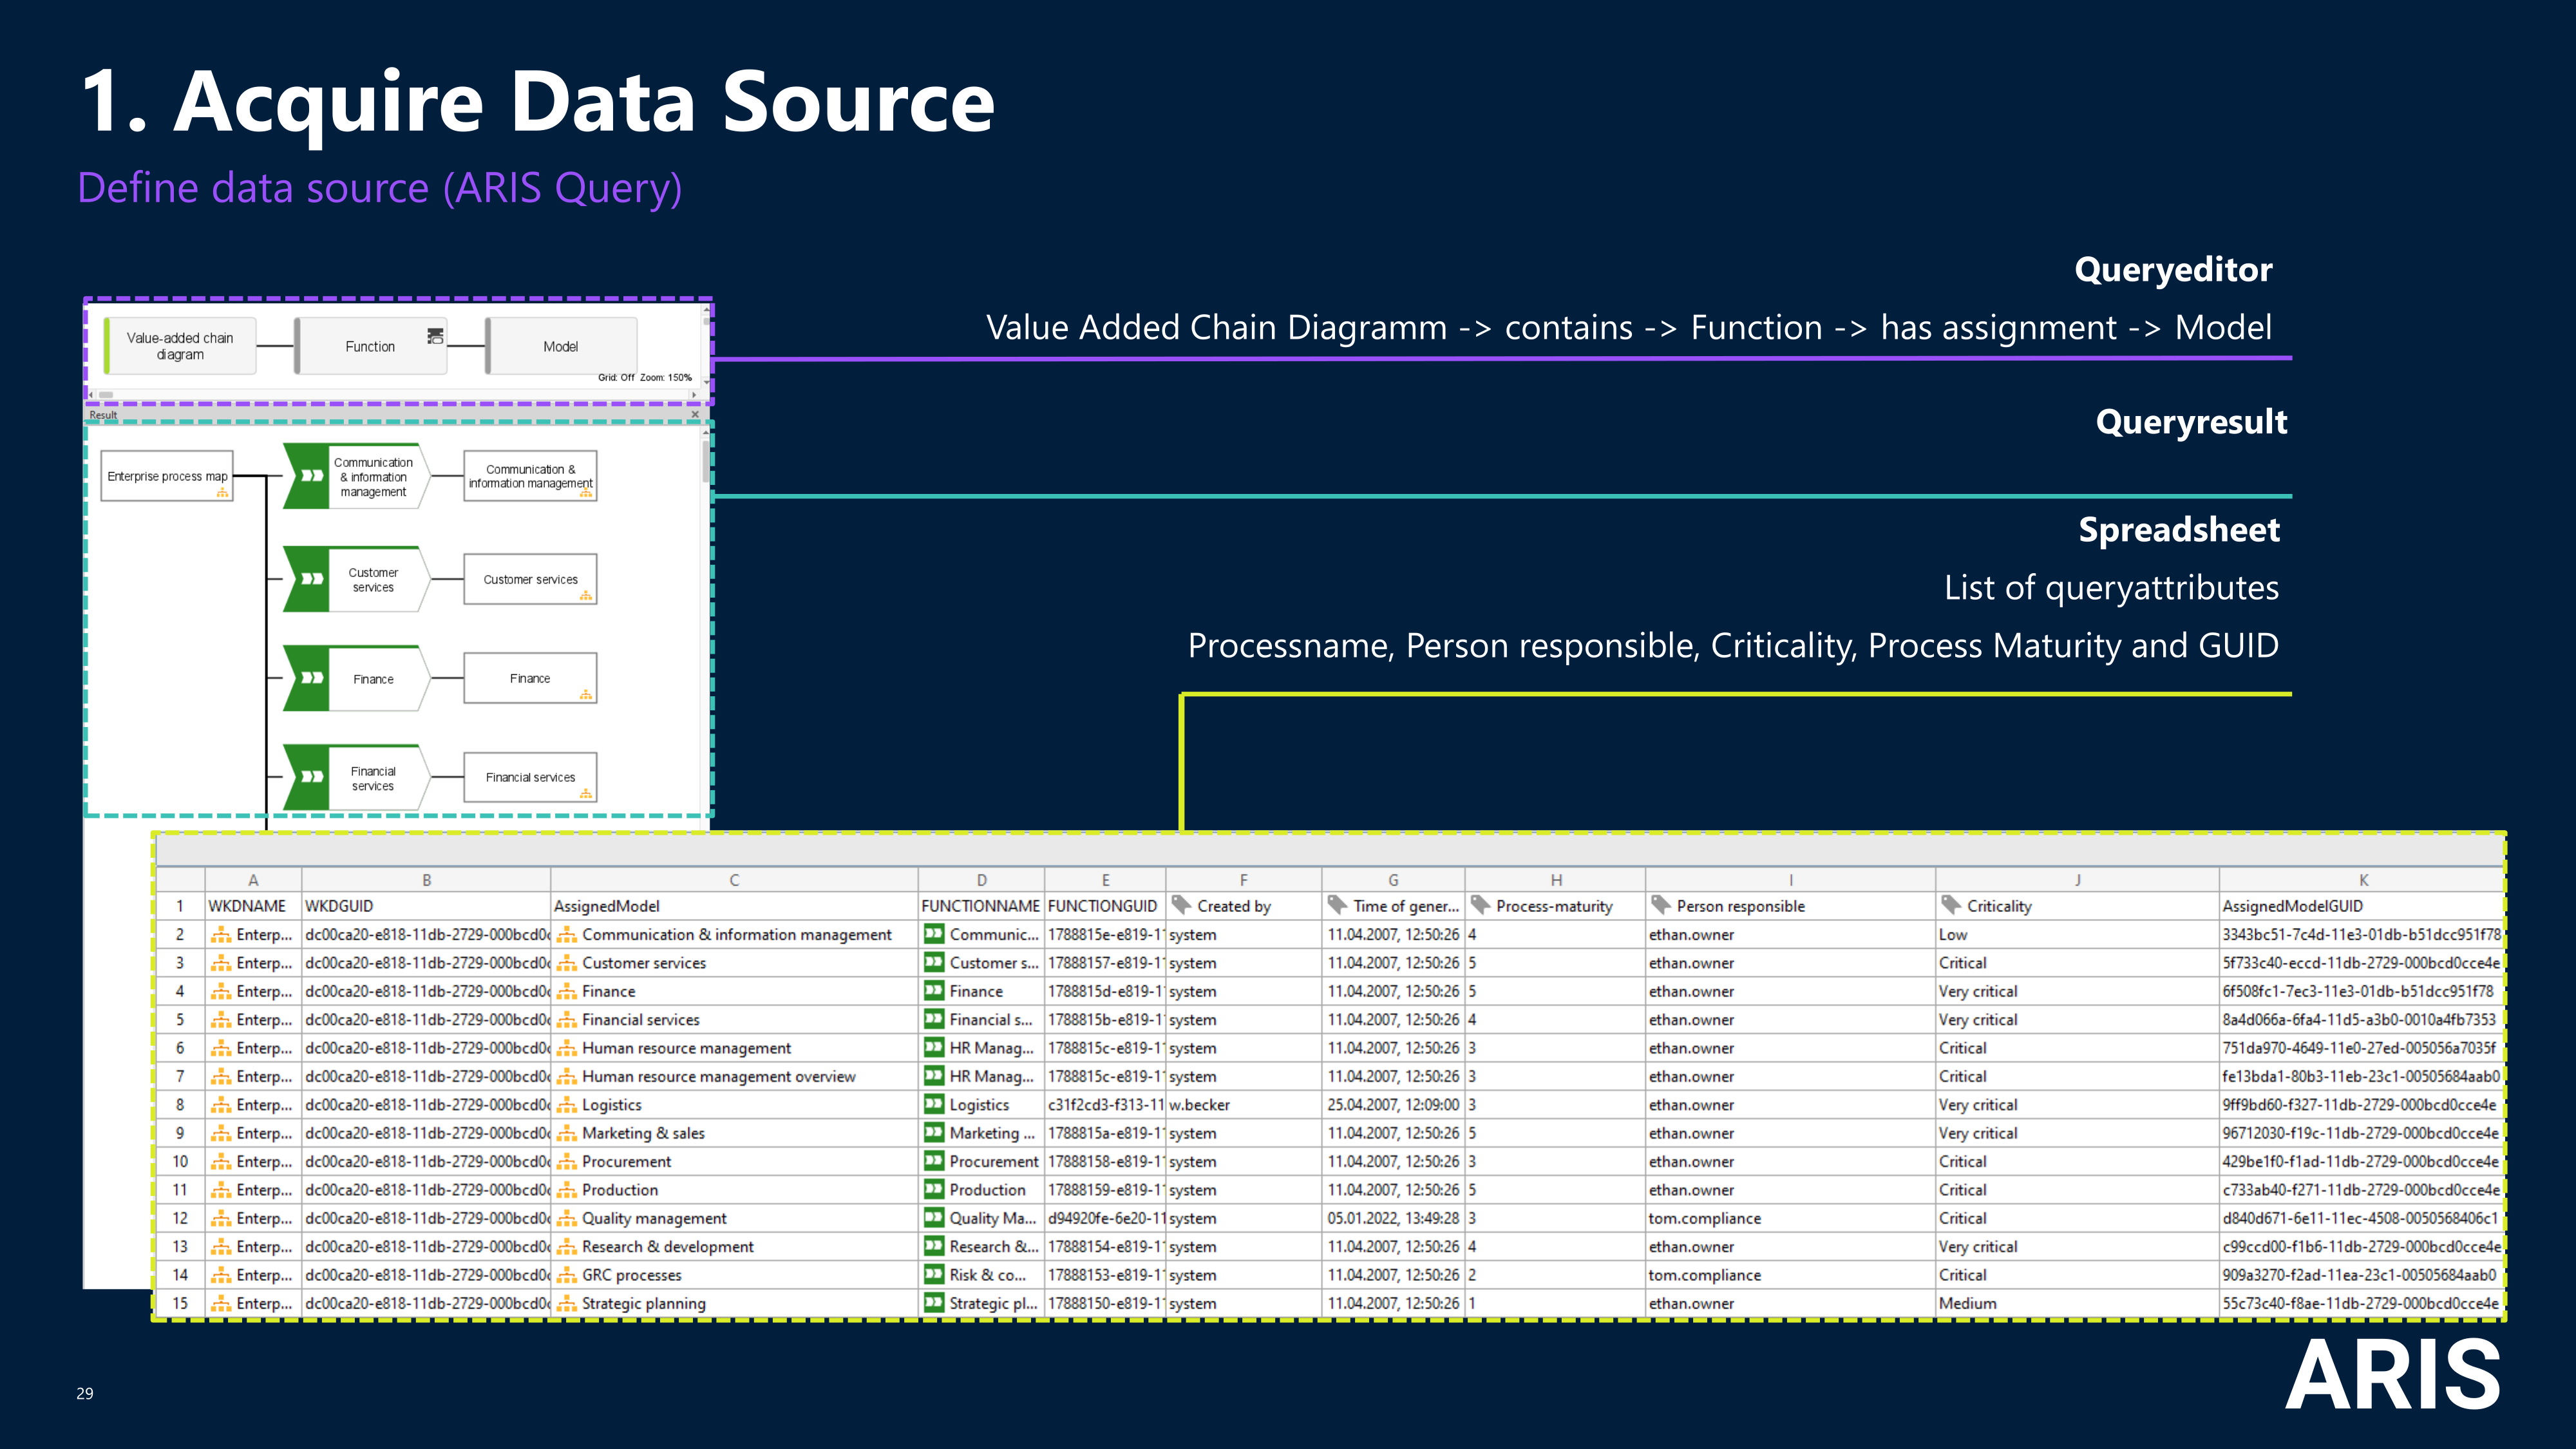
For fast dashboard creation, you can always start by building your dashboard based on an ARIS query for a smaller dataset to prove the value of your use case.
In a second step, you can always switch to either an existing or customized (scheduled) ARIS Report, a relational database or with the upcoming ARIS 10 SR28 release even the result of the ARIS repository search for performance tuning.
Within the ARIS DataFeedEditor it is very easy to switch between datasources.
2. Mash up datafeed
In this step you usually combine your data from (optional) different datasouces, enhance your data (add some preparation for filters, actions or different visualizations) in your dashboard).
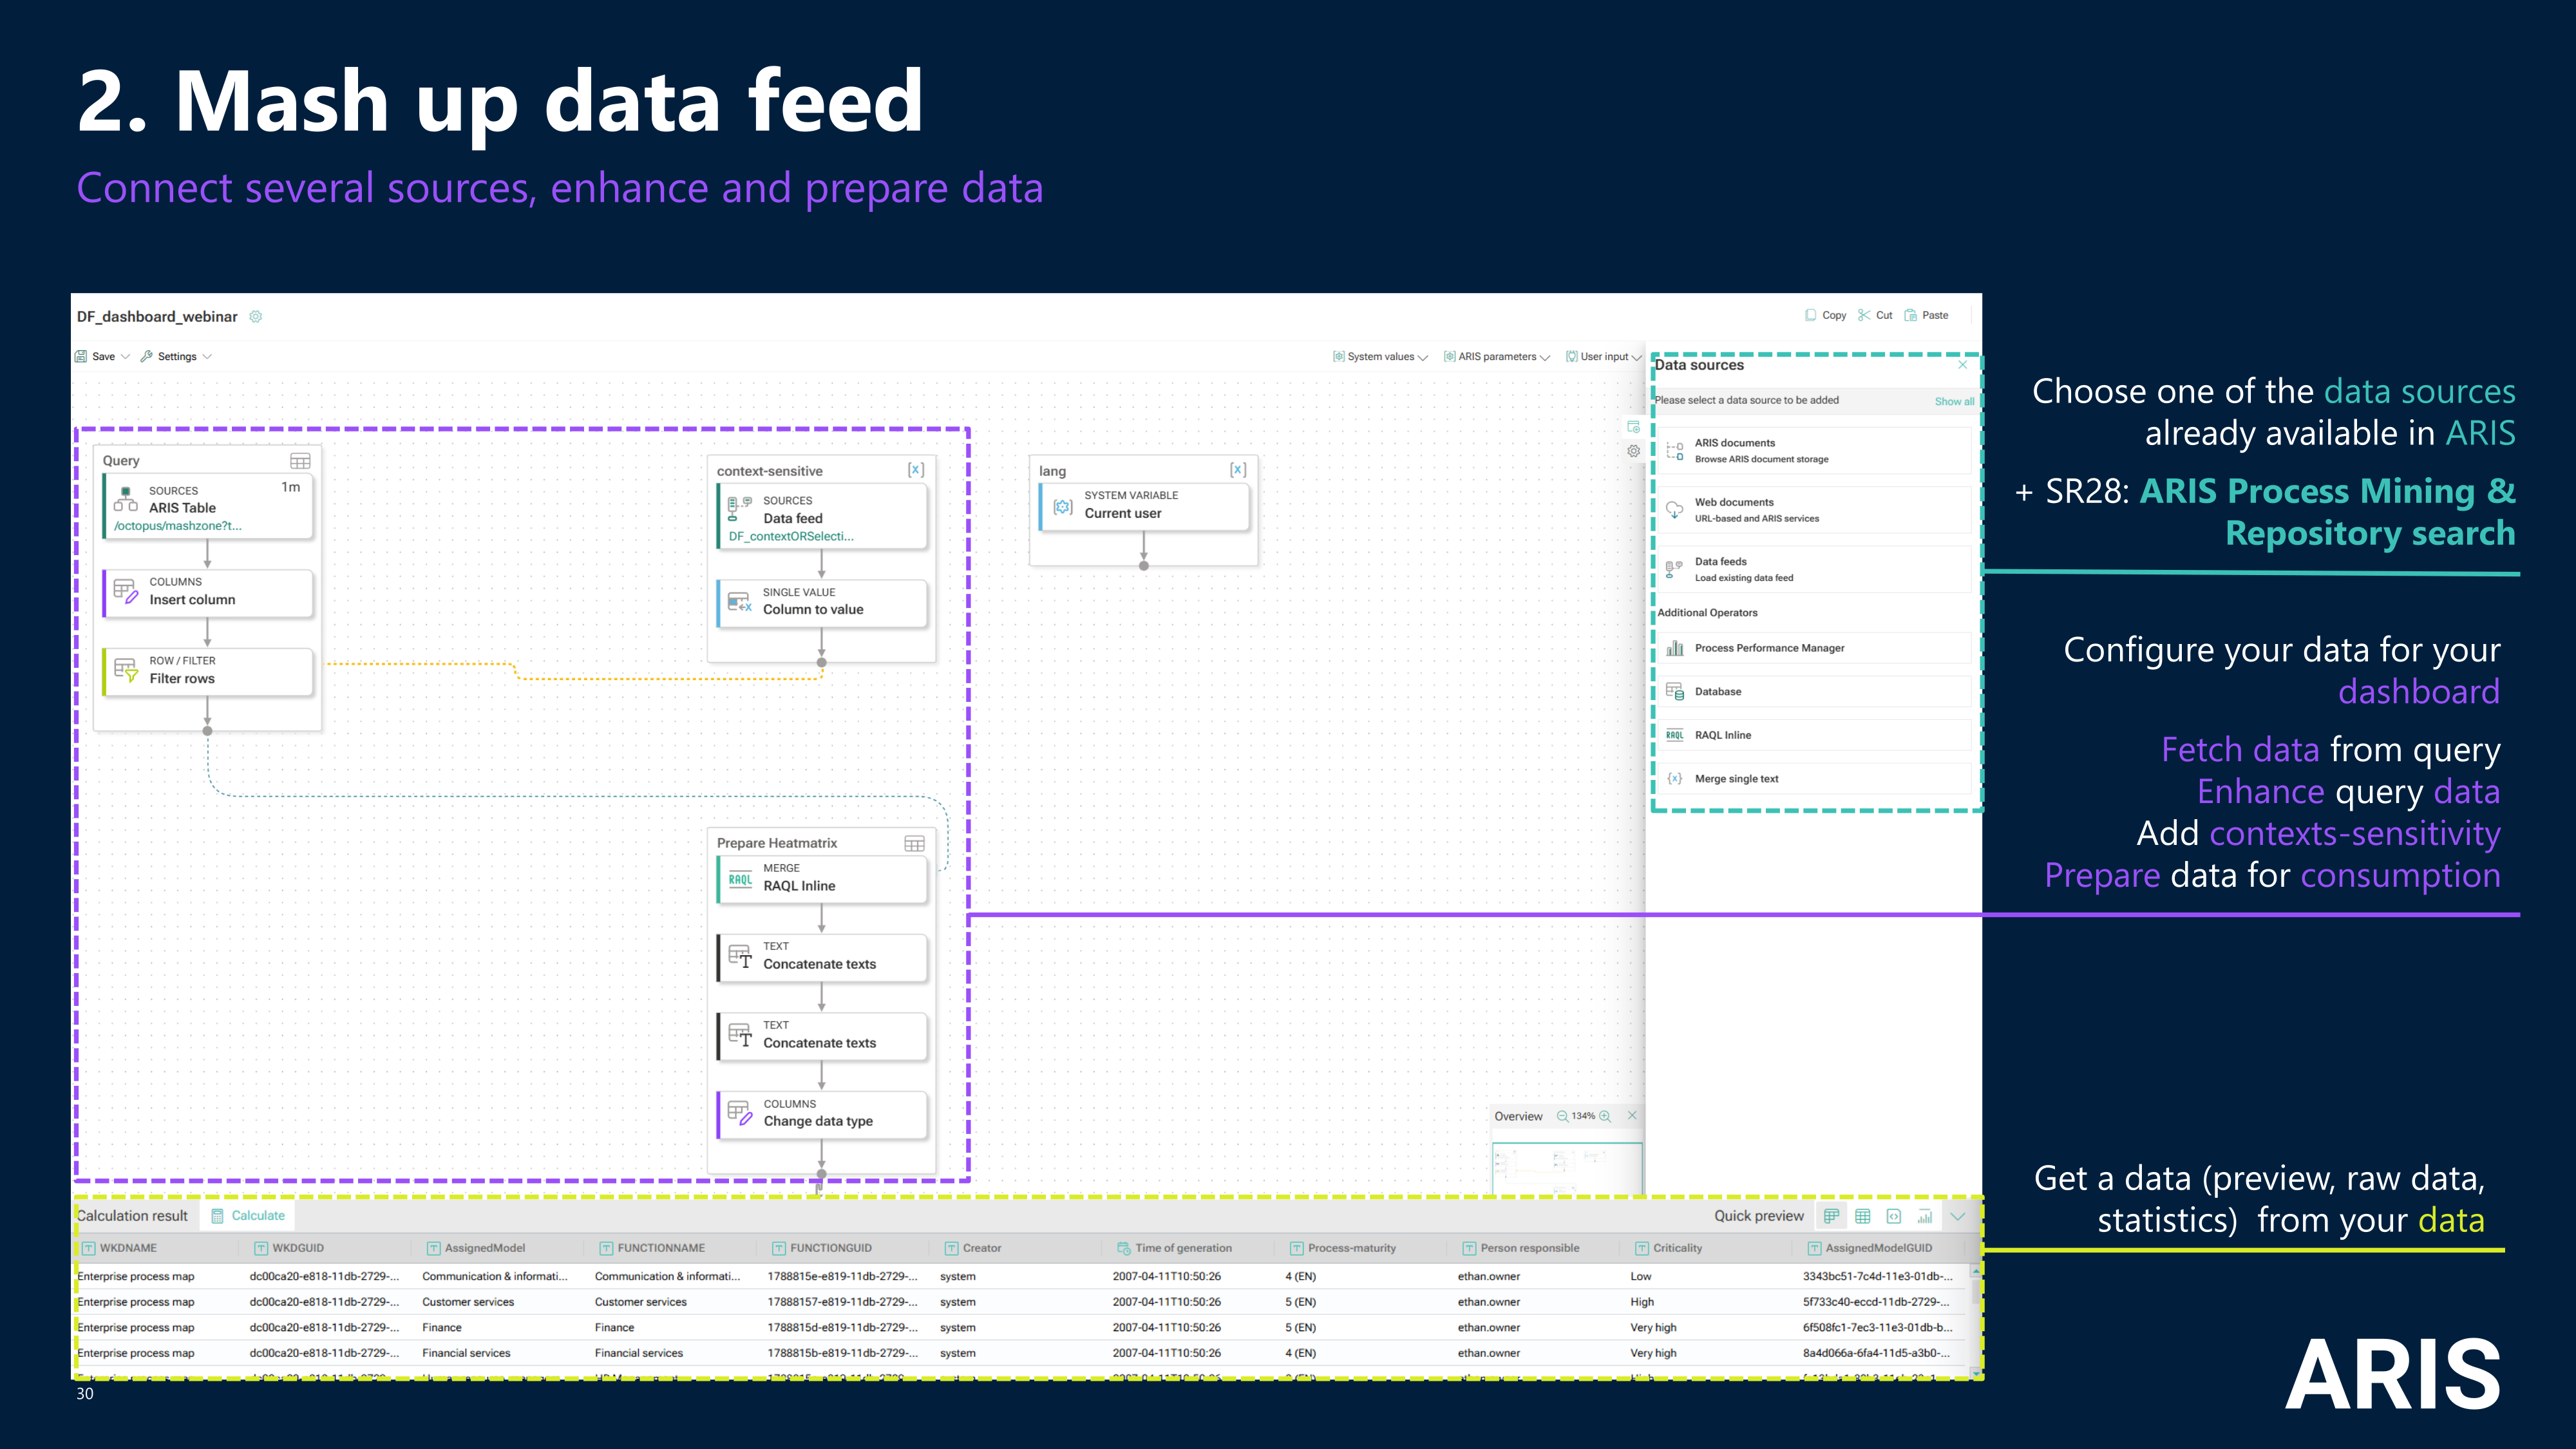
Data feeds can be easily enhanced or changed (even between data sources) a typical development cycle would be
- Show data of Query: Connect Query to Output -> Show data preview
- Create a row Counter: Enhance Query with “Insert column” operator
- Make the dashboard context sensitive: Enhance Query with “Filter rows” operator connect to “context sensitive” datafeed
- Prepare data for widget “heatmatrix”: Concatenate Criticality ID & Description in one column
- Ensure consistency of your mandatory data: Change from data preview to statistics

3. Build your dashboard
In this step you define all you need to focus the right stakeholders on the right data for the first time and decide on your use case specific actions you want to derive out of this analysis to gain most value out of your data.
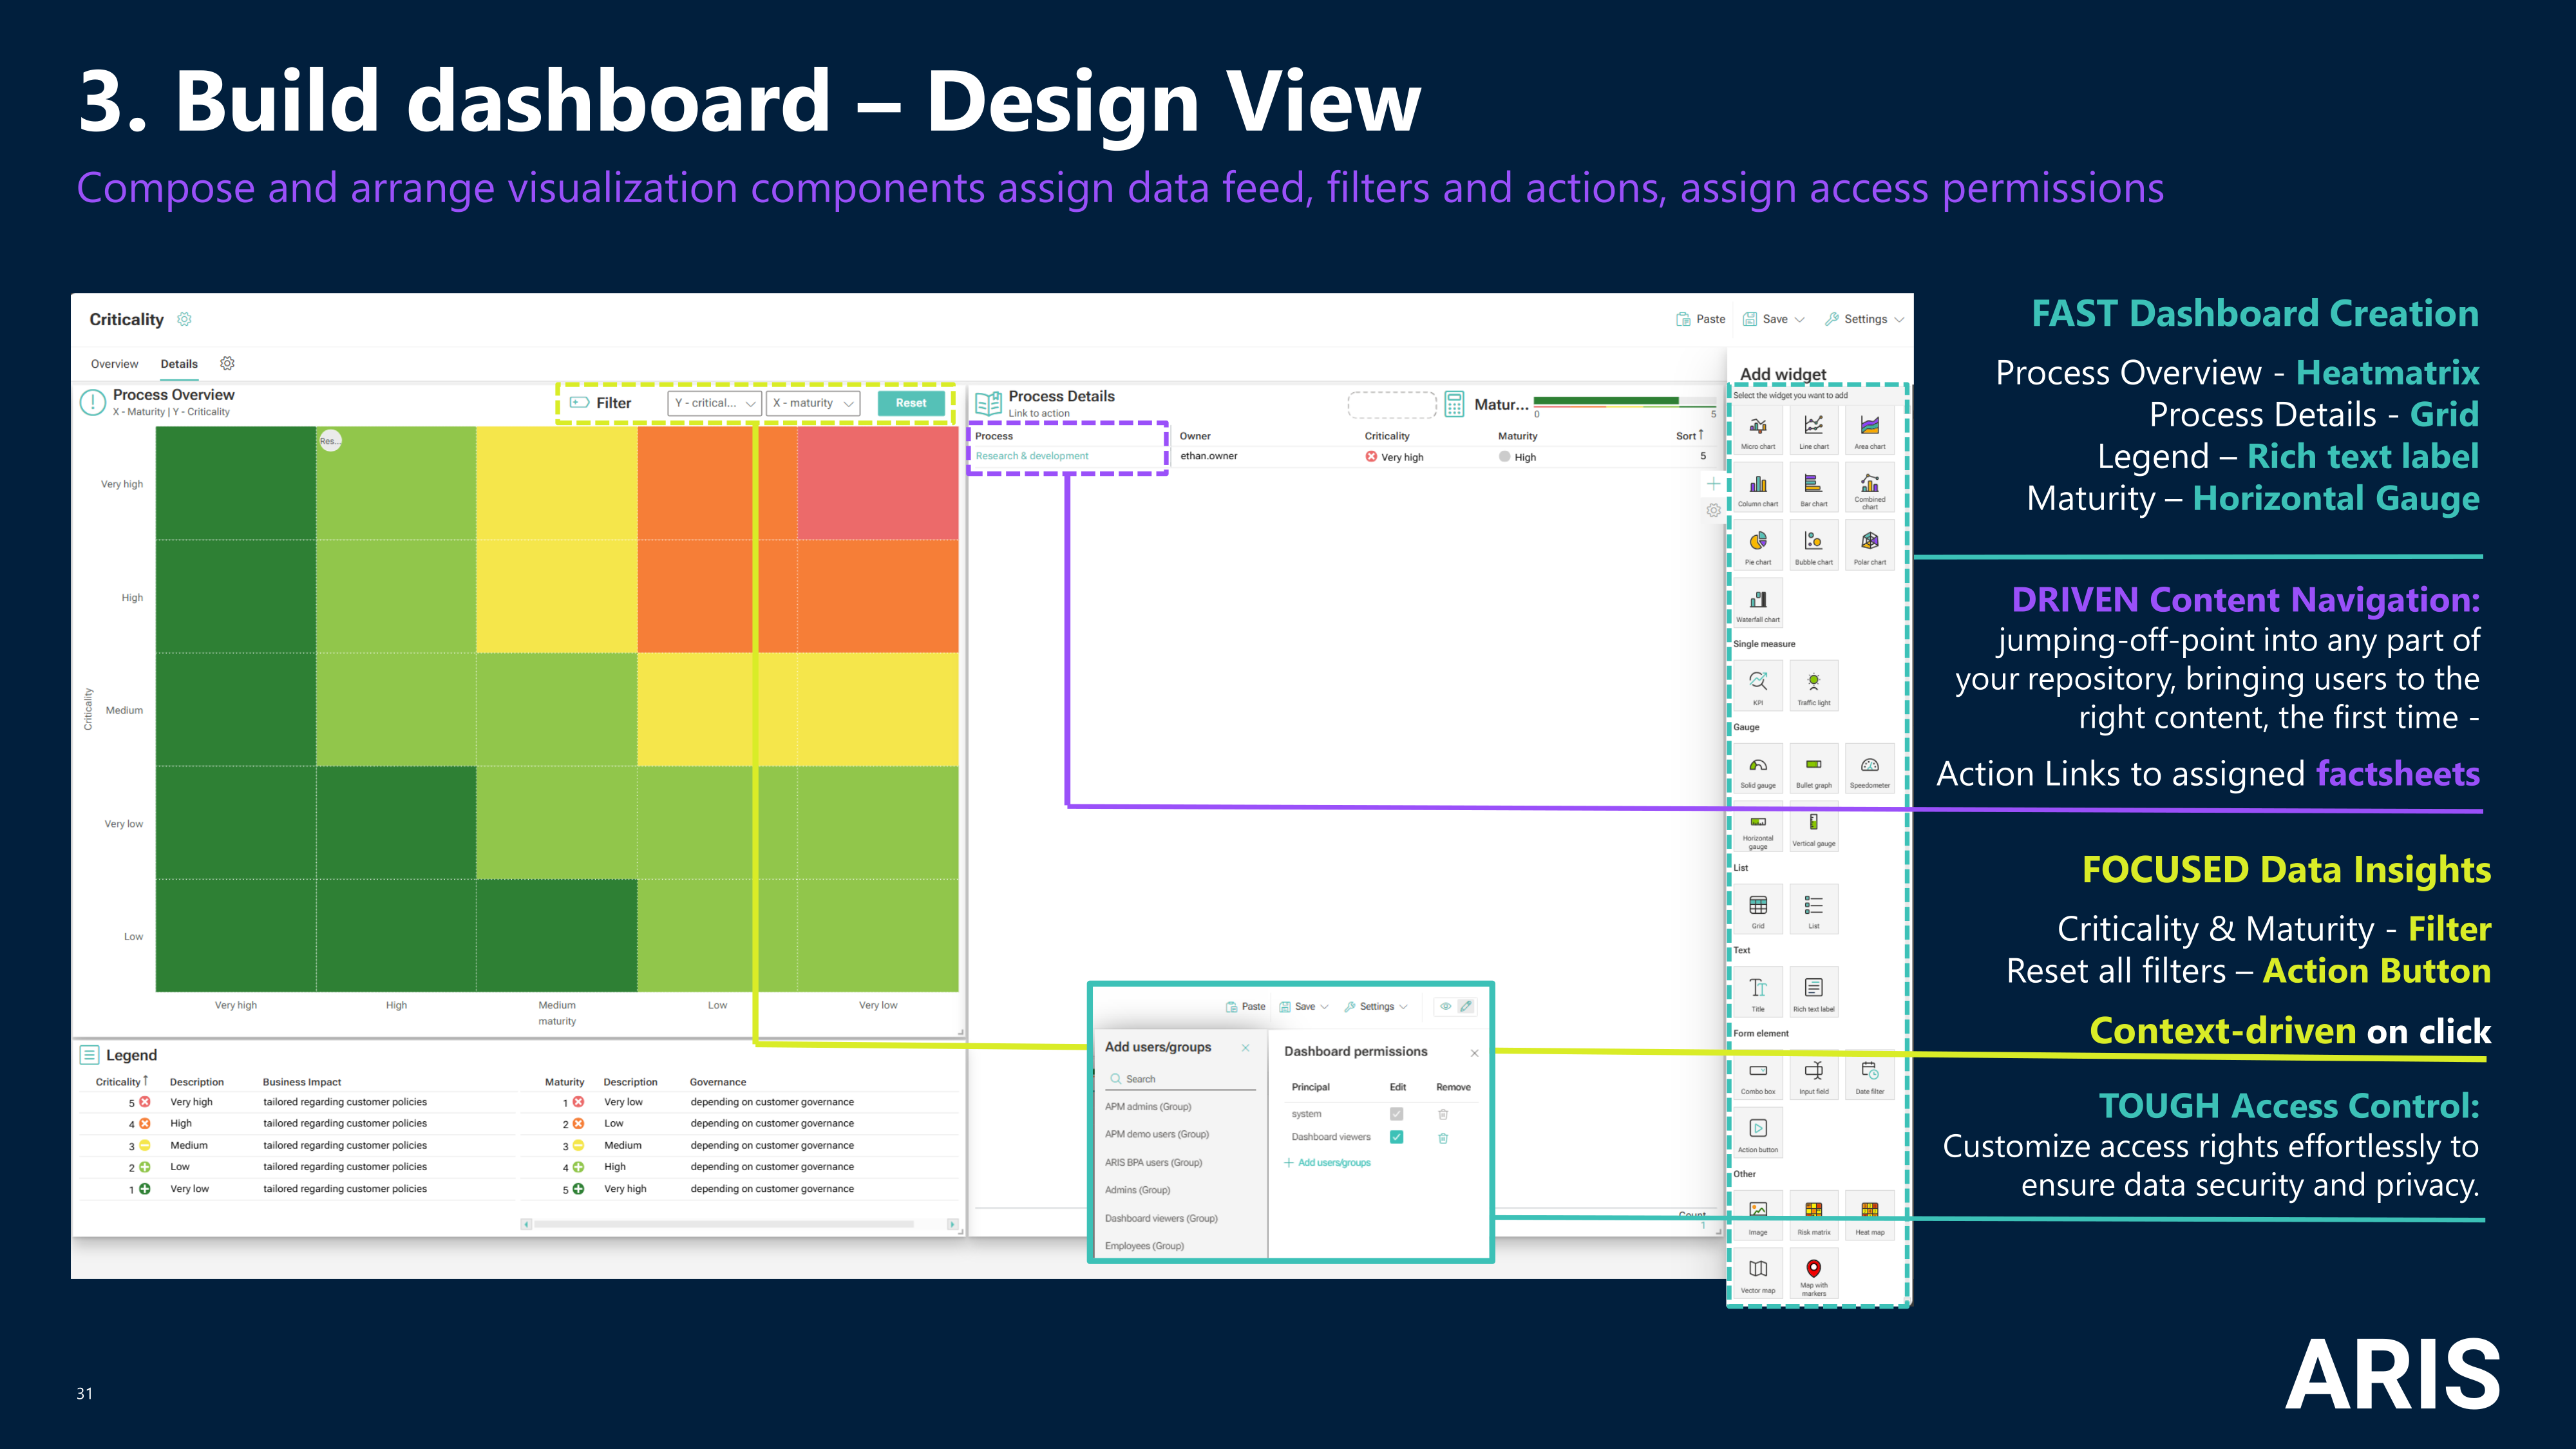
Enable the right stakeholders
ARIS dashboards are reusing the tough access control you have already set up in your repository. You can easily set up access control reusing your existing ARIS user groups and users).
To focus on the right data
The heatmatrix widget is perfect if you want to show the dependencies between process criticality and process maturity. You can tailor the granularity, and the CI colors based on your needs. To set your desired stakeholders’ attentions on the most important data.
Accomplished with a detail list, including a meaningful legend (which will be tailored on your companies policies and governance requirements) and of course content driven navigation (supported by actions through the already existing process hierarchy of your repository), this will speed up the analysis time and make it very easy for your stakeholders to understand the analysis results to set the appropriate actions for increasing the maturity of your most critical processes.
To set the appropriate actions: For improving process maturity
ARIS Dashboards are fully integrated in the ARIS world.
You can decide how you want to address any issue to the process owner
- unstructured simply using the ARIS collaboration or MS Teams,
- structured using existing ARIS Governance workflows like “Inform process owner”
- your own ARIS Governance workflows fast created with ARIS Flows (SR28)
- or simply raise an ARIS Risk and compliance (ARCM) issue to start a maturity assessment optionally also followed with ARCM survey.
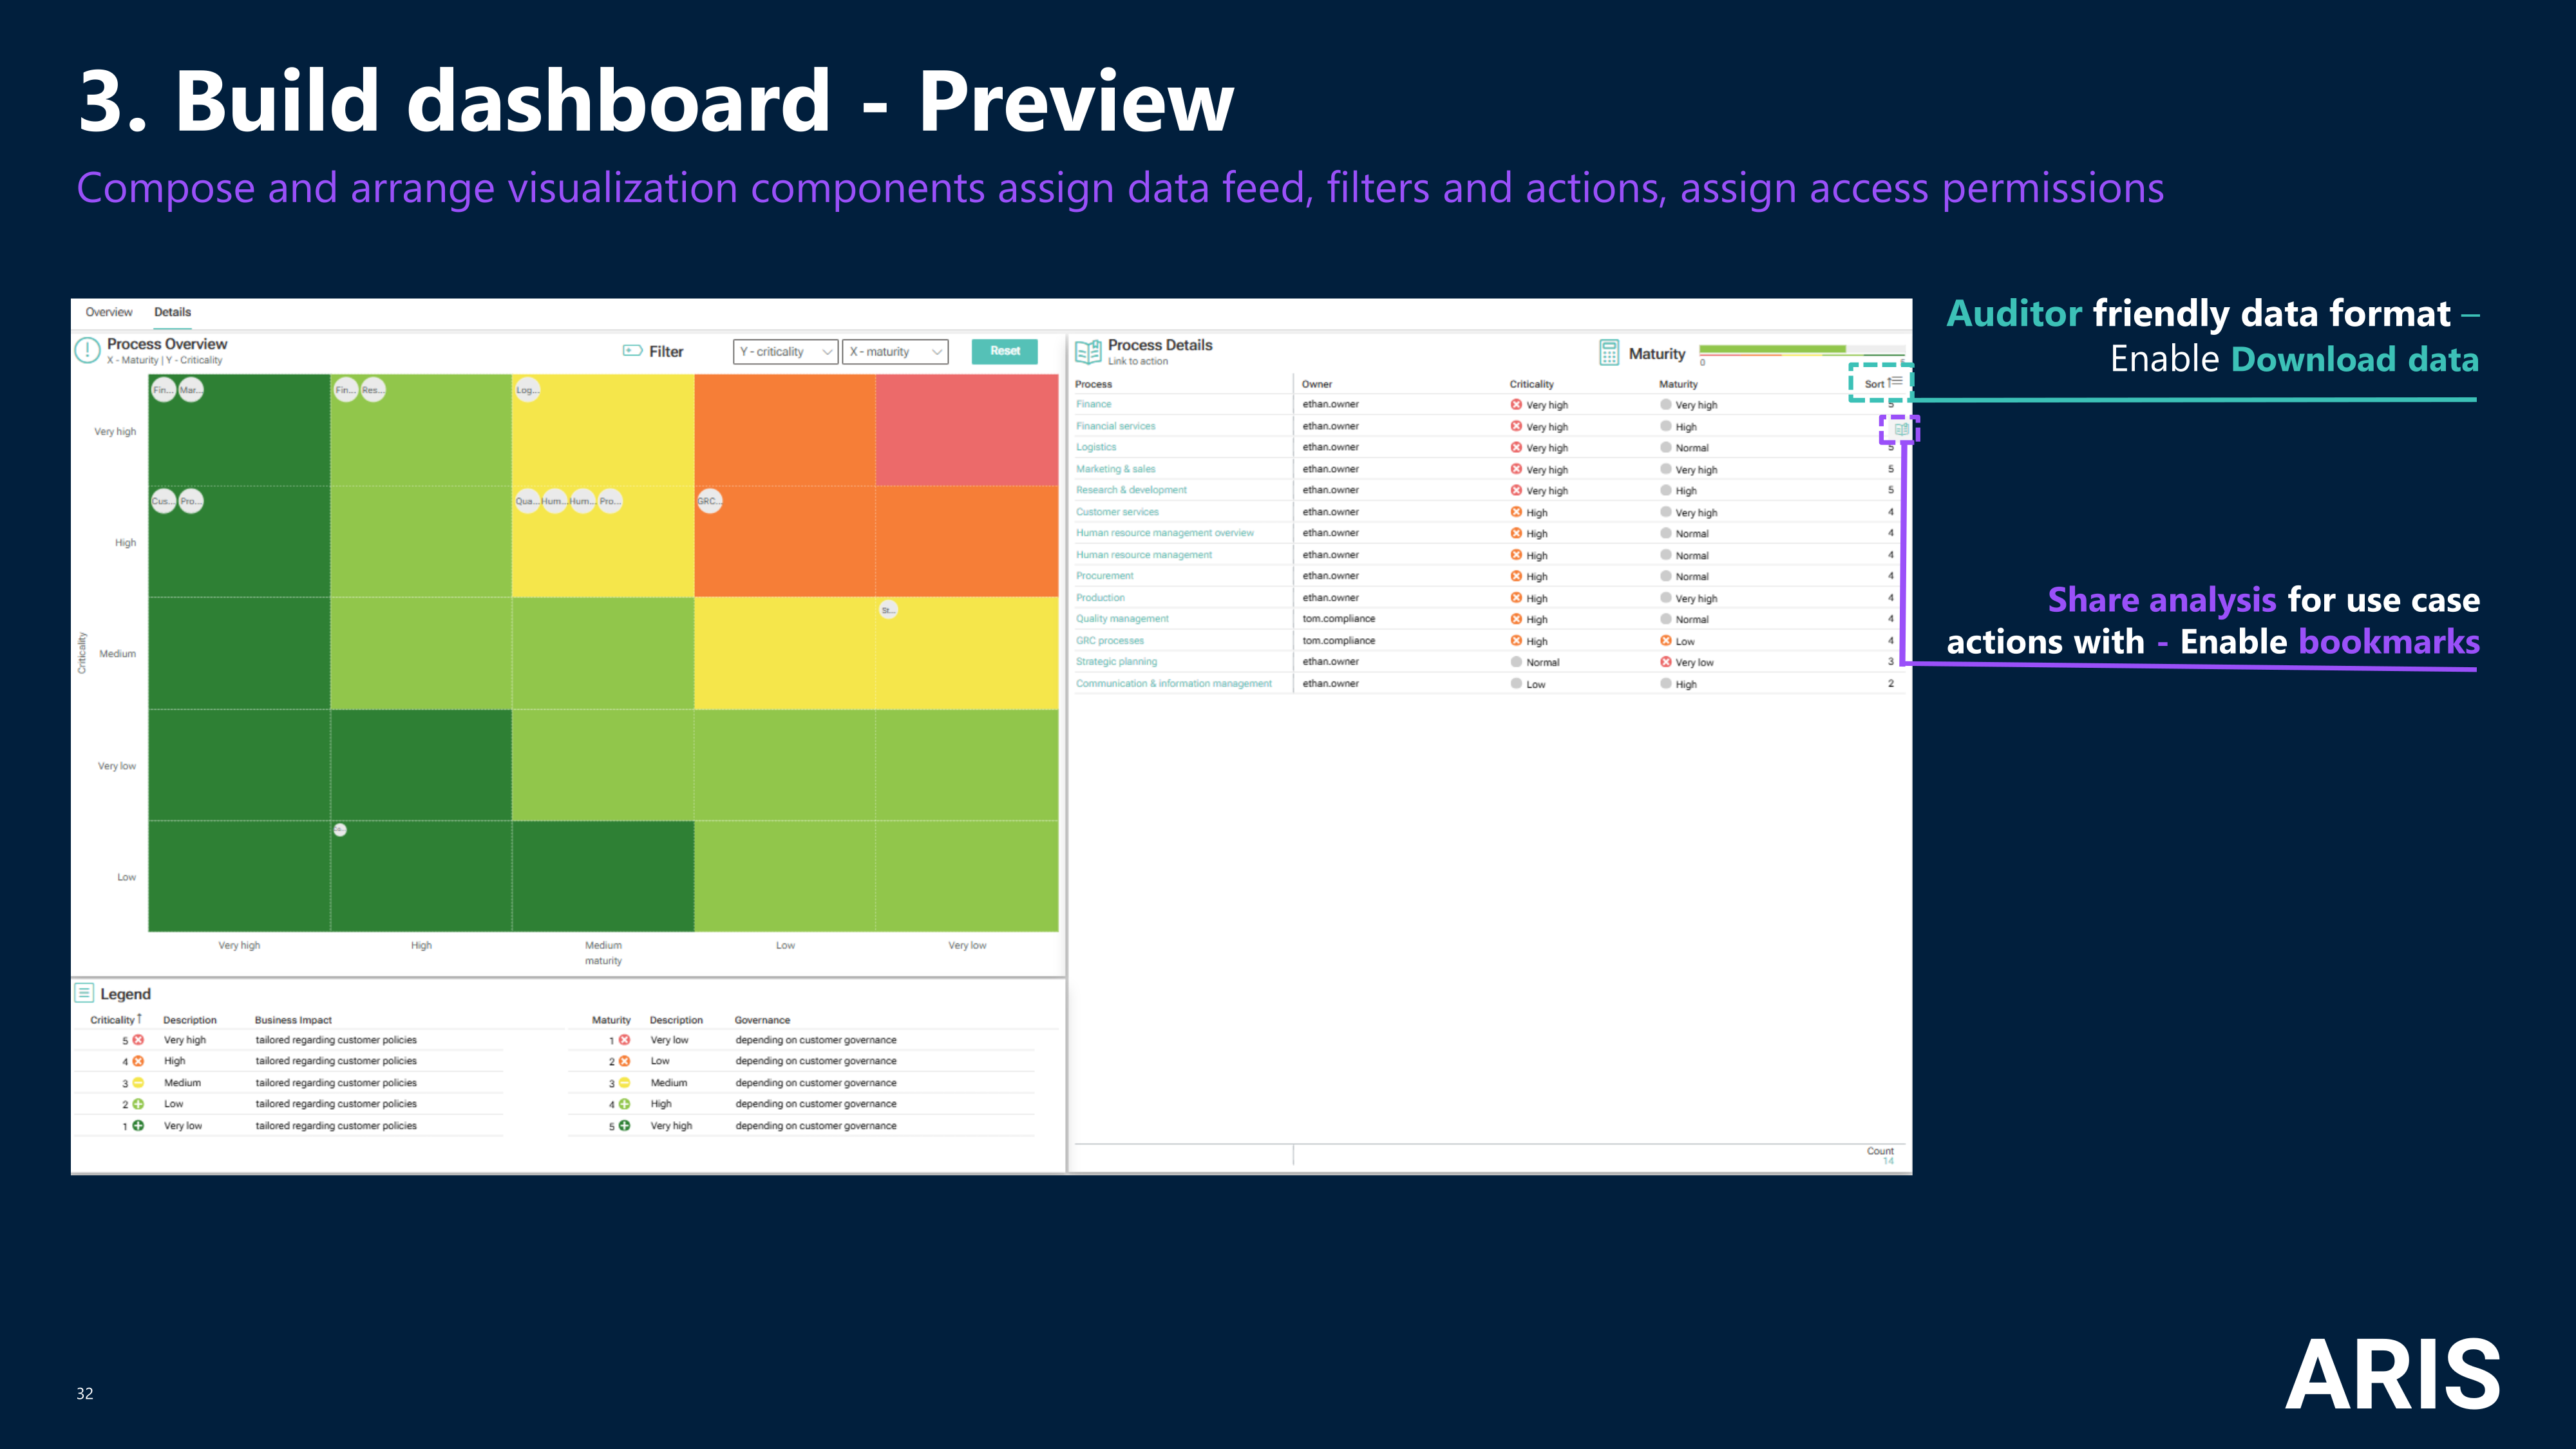
To ultimately reach your use case goals
To ensure and improve process maturity to ultimately support audit readiness and business continuity.
Accomplished by providing this data to an auditor in an easily usable format, it significantly enhances the efficiency and effectiveness of the audit process. Simply enable download data option for the relevant detail widget
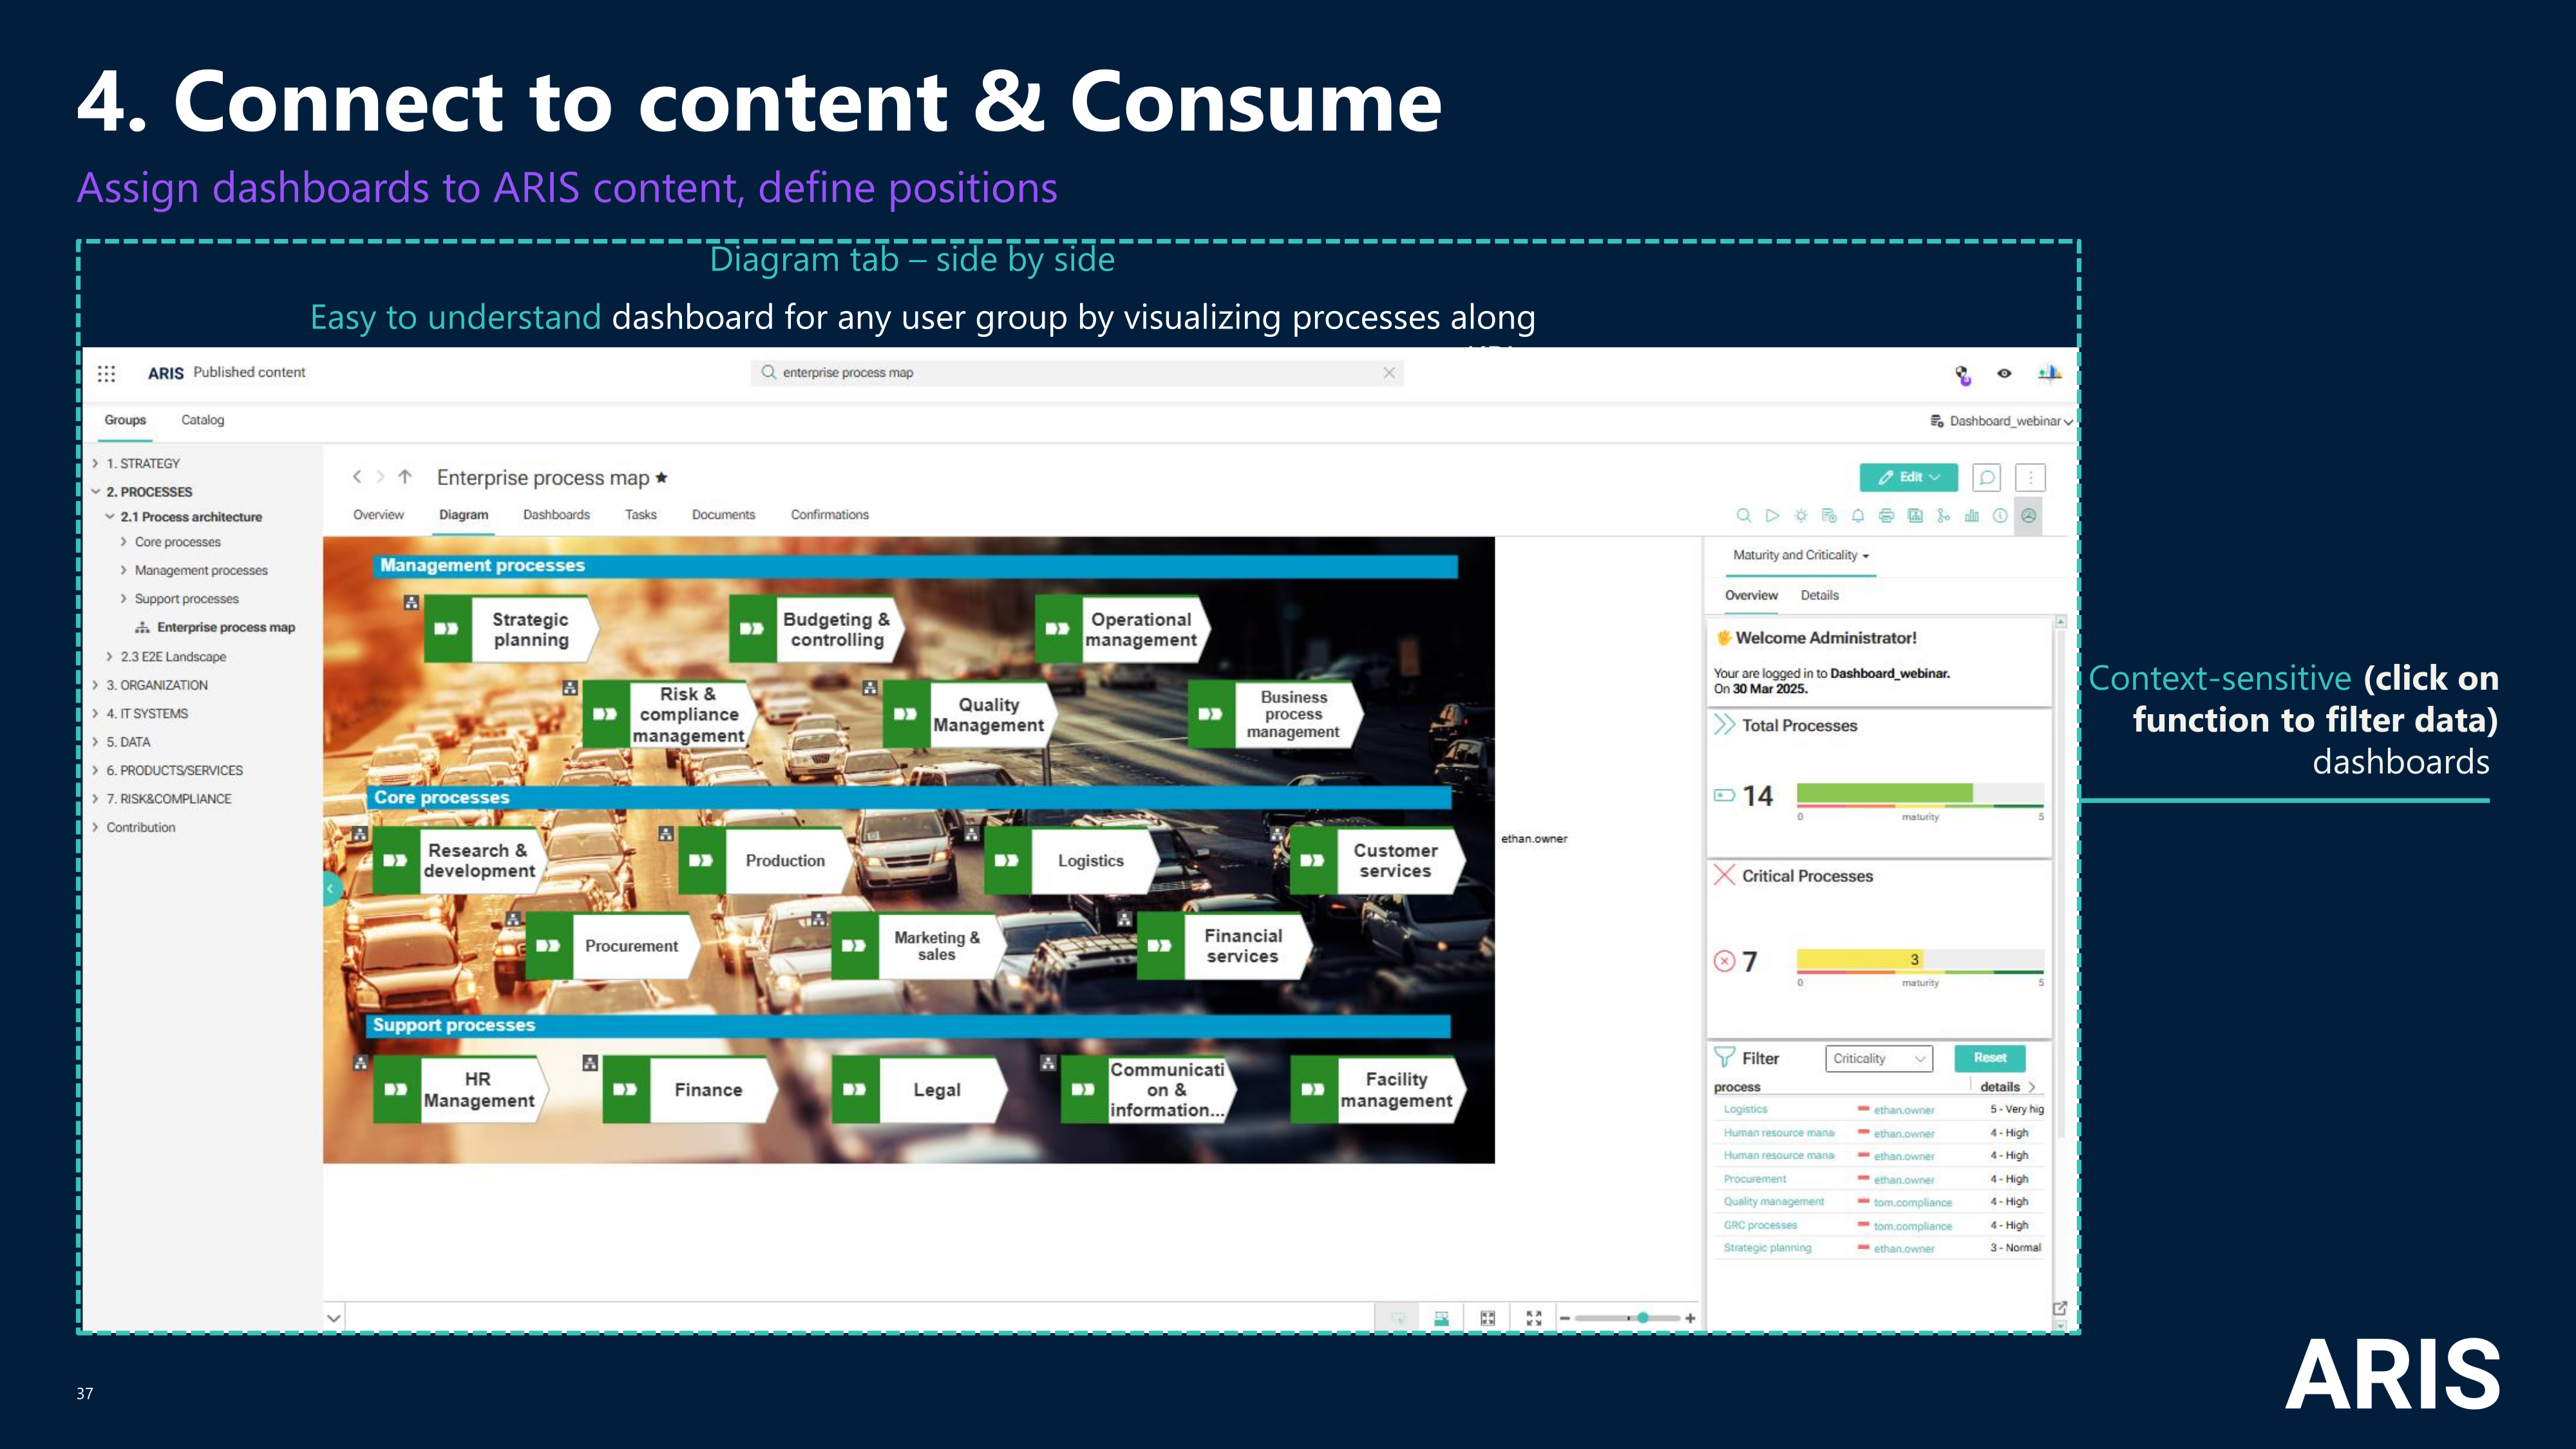
4. Connect content to consume
You can publish and connect dashboards in the ARIS portal based on your needs
- Generic like on the home or landing page, dashboard page of your ARIS Portal
- specific types or IDs of your (processes, chains, risks, groups, etc…) on different factsheets like overview, diagram, dashboard factsheet
- for certain or all ARIS databases
In our case we have defined the publication of the dashboard
- type = value added chain diagram (for process landscapes)
- database = dashboard_webinar
- on overview, diagram and dashboard factsheet.

Following this 4 steps approach of scoping and building an ARIS dashboard we have finally implemented our use case to ensure and improve process maturity to ultimately support audit readiness and business continuity.
A huge thank you to Thorsten Auriga and Norman Lee for sharing their business expertise, which helped us build a solid and insightful business use case together based on a customer question. Who's next? We're ready to tackle your queries! 🙌📊
Our dashboard blog topics:
- Standard use cases and how to adjust them to your needs
- Guidelines on how to build your very own dashboard use cases from your business questions, including hints on data visualization techniques and guidelines how to design and optimize data feeds
- Blogs regarding your shared customer use cases
Here is the deal: You provide the question and sufficient detail, so that we can provide meaningful advice. In exchange we will provide the desired information via a blog post.
That's a wrap for today's tech talk on ARIS dashboarding!
See you soon! Remember, ARIS dashboards help you easily focus on the right data for the right stakeholders, enabling the right actions to drive your success.
Monika (20+years experience in BI/Mining/Transformation) & Thorsten (25+years experience in Integration & ARIS and an “ARIS - Jack of all trades”) & Norman (20+years experience in ARIS) & Helmut (Dashboarding developer since 2009)
P.S.
- Access to free self-paced training ARIS Dashboard Basic
- ARIS documentation has moved to docs.aris.com
P.P.S. We are thrilled with the feedback we've received so far and are eager to hear more about how you're using ARIS dashboards! Feel free to share your use cases or use case related questions in either English or German. Your insights are invaluable to us!
Veronika Ellermann on
This is truly awesome!
A very comprehensive overview of how to implement the heat matrix (the widget and I don't get along well^^ Most likely with your instructions, the widget's and my relationship will improve :D)