As you might know we started a sequel where we promote and give away for free ARIS reports that cover specific topics. Today it’s up to me to introduce ARIS Risk & Weak Point Analysis you. If this sequel shows success and is adopted by the community, it might be that we will continue to offer these goodies that help our users to benefit even more from their investments in ARIS.
But let’s come down to business...
In my previous post "Free-of-charge ARIS report: ARIS Enterprise Asset Evaluation" on the fourth of February 2010 I illustrated the "Enterprise Asset Evaluation" report, a portfolio analysis in ARIS.
Portfolio analysis is a great tool to prepare management decisions. Today, I deliver insight into the "Risk & Weak Point Analysis" report, which is a Portfolio analysis too, based on ARIS. But now let’s come to the details I got from R&D...
Risk & Weak Point Analysis
The report "Risk & Weak Point Analysis" generates your personalized answers for questions such as:
- Where are my risks & weak points?
- Who is responsible for them?
- How often could they happen?
- What might be the potential damage?
- How can we eliminate them?
- How much will it cost to implement this solution?
The ARIS report can be executed on groups or concrete models of type EPC, value-added chain diagram (VACD), function allocation diagram (FAD) and business controls diagram (BCD). With the report you are able to identify "critical" values like costs, time for implementation, criticality etc. With the ARIS "Risk & Weak Point Analysis" report I generate MS EXCEL spreadsheets and a HTML output . I can identify and evaluate risks and weak points en block faster & easier, because of special attributes for identification, description and definition of solutions for elimination of risks & weak points.
By executing the report you get an automatic identification and marking of "critical" values (e.g. amount of damage, implementation costs, frequency, etc.). Besides the generated sheets, you also get a graphical representation of the analysis.
Report Download & Setup
To get started, download the ARIS Risk & Weak Point Analysis and save it on your hard disk. Please note, you can only download the report if you are currently logged in to ARIS Community. The download is an ARX file.
Make sure that you have ARIS Business Architect with the newest release, because you need the administration module to import the report. In case you only got ARIS Business Designer on your machine, you must ask your ARIS administrator to install the report for you.
For more information about downloading & setting up reports and macros in ARIS, read this previous article "Reports and macros in ARIS".
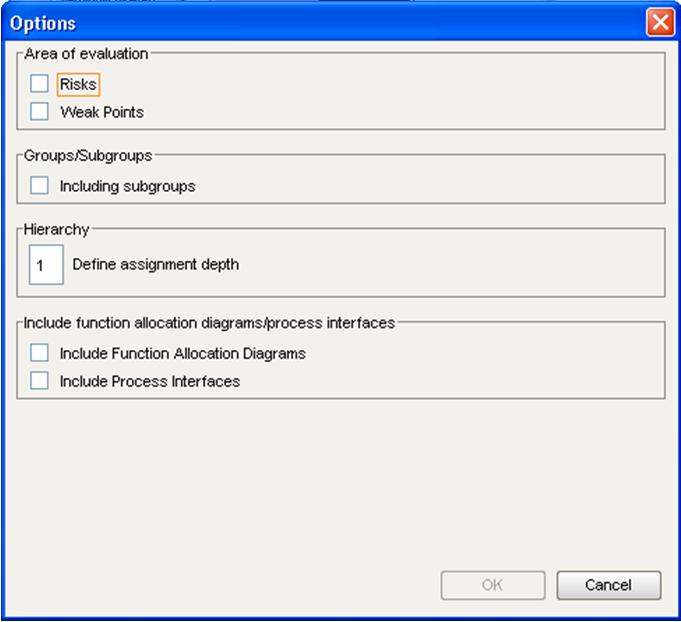
After download and installation, you can define various options before executing the report.
Running the report
It is very important that you have imported the "Enterprise Asset Evaluation" report too. Both reports work together. Read for more information of the "Enterprise Asset Evaluation" report the previous article "Free-of-charge ARIS report: ARIS Enterprise Asset Evaluation".
Furthermore make sure that all needed attributes are maintained. The report does not work without these attributes:
For Risks
Process: Process name, Function name (related function), Organization
Risk: Name AT_NAME, Risk ID AT_AAM_RISK_ID, Description AT_DESC, Risk types, AT_AAM_RISK_TYPE_FINANCIAL_REPORT, AT_AAM_RISK_TYPE_COMPLIANCE, AT_AAM_RISK_TYPE_OPERATIONS
Assertions: AT_AAM_ASSERTIONS_EXIST_OCCURRENCE, AT_AAM_ASSERTIONS_COMPLETENESS, AT_AAM_ASSERTIONS_RIGHTS_OBLIGATIONS, AT_AAM_ASSERTIONS_VALUATION_ALLOCATION, AT_AAM_ASSERTIONS_PRESENTATION_DISCLOSURE, AT_AAM_ASSERTIONS_NA
Risk Assessment: Assessment activities AT_GRC_ASSESSMENT_ACTIVITIES, Assessment frequency AT_GRC_ASSESSMENT_FREQUENCY, Start date of risk assessment AT_GRC_START_DATE_OF_RISK_ASSESSMENTS, End date of risk assessment AT_GRC_END_DATE_OF_RISK_ASSESSMENTS, Basis of assessment AT_RISK_EST, Data source AT_RISK_DTA_ORIG, Occurrence frequency of the average amount of damages (AT_FREQU_AVG_LOSS), Average amount of damages (AT_AVG_LOSS), Reduced occurrence frequency of the average amount of damages (AT_FREQU_AVG_LOSS), Reduced average amount of damages (AT_AVG_LOSS)
For Weak points
Process: Process name, Function name (related function), Organization
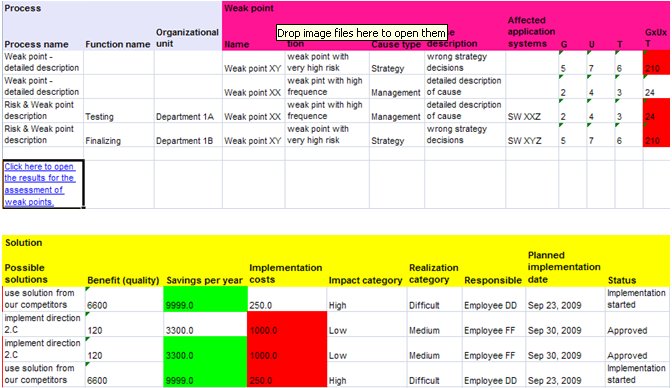
Weak point: Name, Description, Cause type (organizational weak point, technical weak point, personnel weak point, other... from brasil), Cause description, Affected IT-Systems, Gravity, Tendency, Urgency, GxUxT (amount back to aris) - error message if object is locked (3 highest amount will be red)
Solution: Possible Solution, Benefit (qualitative), Savings per year (quantitative) (3 highest will be green), Implementation costs (3 highest amount will be red), Impact category (low, medium, high), Realization category (easy, medium, difficult), Responsible person (modeled in BCD), Planned implementation date, Status (approved, rejected, implementation started, implemented)
When running the report you will configure how the report information will be displayed. It depends on the options you choose.
The report will evaluate object type "Risk" = standard symbols for risks and new symbol "Weak point" for weaknesses . The new symbol for "Weak point" is a user defined symbol, you find this symbol in the filter, you have imported.
The organizational responsibility according to the concrete weakness will be described not via text in attributes, but as a relationship between organizational element (object type "person type") and "Weak point"/"Risk" object . This direct relationship will be available only in Business controls diagram (only one type of connection "is technically responsible for").
In an EPC diagram, the connection between "Weak point"/"Risk" and object type "Application System" and connection between "Weak point"/"Risk" and organizational element will be possible only via object type "function".
Report output
The report output depends on the option you define how the report should evaluate the selected artifacts. It will contain separate sheets for risks or for weaknesses or both. It besides of evaluation of attributes in excel table (values in columns), whether the report should contain also a graphical 3D evaluation or at least only a 2D evaluation.
Below, you can see an example report, for weak points and risks.
An example report of risks in 3D looks as follows.
What is the advantage of doing this in a repository based tooling?
- Relationship to other ARIS artifacts
- Centralized administration of data
- Easy to update
My test were quiet promising and I hope you will find it useful, too.
If you’re using it and make very profitable decisions, we’re always happy about a donation. But of course it comes w/o any warranties (for the tool, calculations or business success).
Note: Check this post if you are looking for other free ARIS reports & macros. If you want to discuss ARIS scripting problems, make sure to join the group Reports & Macros in ARIS.


