With ARIS 9, you gain powerful tools to browse, analyze and evaluate all relevant information in ARIS to increase the value of your BPA, EA and GRC initiatives. You can:
- Access data in the ARIS repository easily to conduct comprehensive analytics using a three-step approach: Query – Template – Result
- Define queries with the help of a graphical query builder and define how the data will be visualized—for example, in Microsoft®Excel® spreadsheets, Microsoft®Word documents or ARIS MashZone dashboards
- Browse the database in real-time regardless of ARIS model definitions
- Design, save and update customized viewpoints based on browsing results
Ad Hoc Analysis
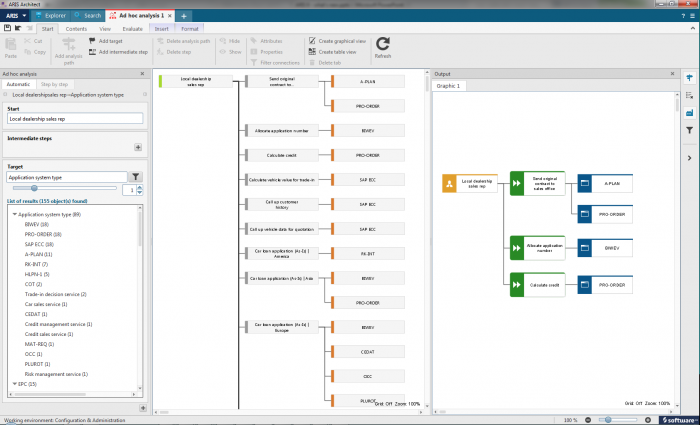
Visualize complicated interrelationships in a database with just a view mouse clicks either automatically or step by step. The interrelationships are represented graphically as an analysis path.
With the analysis you can for example, answer the following questions:
- Which functions do my employees carry out?
- Which position in the company is not occupied?
- Which employees use which application systems?
Depending on your question enter the name of a database group, model or object or a type as a starting point. This allows you to define the analysis as easily as defining a route in your route planner. If you run the analysis automatically, you can insert any steps you want the analysis to run through. Several targets are also possible.
You can however, also define the analysis path step by step. The possible successors of an item are displayed in thematic groups.
The interrelationships are displayed graphically as analysis paths on the tab of the analysis. Analyses can also be combined by subdividing several analysis paths.
All analysis items and connections from the method filter you logged on with are considered. The symbols are not displayed here as ARIS symbols. This happens in the analysis output.
To facilitate working with complex analysis paths you can filter the displayed content in different ways.
When the analysis fits your requirements you can output the entire analysis or parts of it as a table or graphic and add graphic objects or text. All ARIS symbols are displayed in the output with the symbol defined in the method filter. The various outputs are automatically saved with the analysis.
Queries
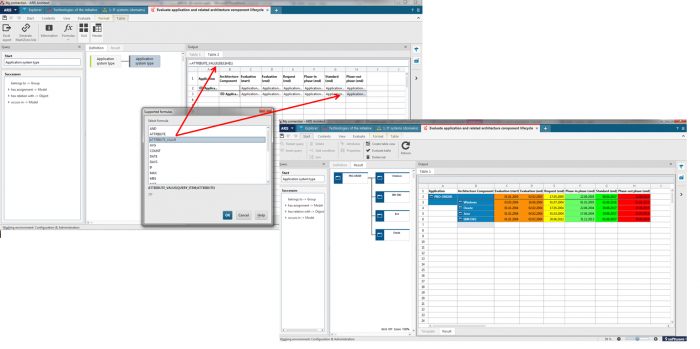
You can create stakeholder oriented analysis use cases to show interrelationships between database items as graphics and in a spreadsheet with the help of queries. Queries are defined based on graphics. For the use of complex calculations a spreadsheet output template can be defined based on the query definition.
Once a template is created and saved, queries can be started for every database of an ARIS Design Server context-sensitively on groups, models and objects.
Query results can be exported to Microsoft®Excel®spreadsheets. You can also define a dashboard link to feed Mash Zone with data from the repository directly without Excel® based reporting.
If you have any questions regarding those new analysis capabilities, please comment.
Stay tuned for the upcoming posts about the new functionalities in ARIS 9! The next one will be about the new UI and pictogram symbols.


Etienne Venter on
Nice article, thanks for sharing.