
This is the final article in our three-part series about process risk simulation. The previous article described how the amount of financial damages from risk occurrence can be determined with simulation. This article will demonstrate how controls can be used to counter risks, either by preventing them or by mitigating their effects. Since controls usually come at a cost it will also provide some information about how to decide if a control is worthwhile to be introduced or not.
Controls are artifacts or procedures which reduce the probability of risk occurrence (preventive controls) or reduce the damages resulting from a risk occurrence (detective controls).
The following figure shows how controls appear in an event-driven process chain (EPC). This is the same example which was used in the previous article except that the two controls have been added. They appear as pale red triangles and are connected to the functions where they are supposed to be carried out as well as to the risks they affect. The connection to the risks is done in so-called business control diagrams which are not shown in the figure. Traits of controls like the control effectiveness or the strength of effects on risk occurrence or damages are specified in attributes which are also not displayed in the diagram.
 Figure: Credit transfer process with risk and control objects
In order to counter the risk of a data transfer error an additional check of the transferred data has been introduced. The risk of a system failure is countered by the provision of a backup system. The former control has been modeled as a detective one and the latter as a preventive one.
With all relevant settings in place, the model is simulated with ARIS Business Simulator. A screenshot of the paused simulation run can be seen in the following figure.
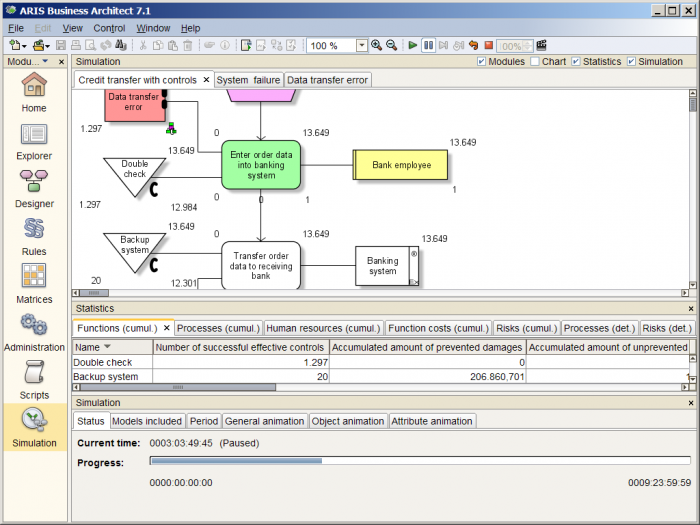 Figure: Simulation with ARIS Business Simulator
The goal of the analysis is to decide if it is sensible to introduce controls for the risks in the process. In the example there is no regulatory or contractual need for them so it suffices to look at the monetary consequences. The idea is to compare the loss reduction a control achieves with the cost it causes. If the loss reduction is higher than the cost, then the control should be implemented. (Such a decision depends on other factors as well, but for the sake of simplicity those are neglected in the example.)
Information about the loss reduction can be found in the cumulative risk statistics and the cumulative function statistics.
The cumulative risk statistics contain information per risk and were already used for analysis in the previous article. The newly acquired data is shown in the following table. It exhibits high amounts of prevented and reduced damages compared to the losses which actually occurred. These results already look quite positive.
| Risk | Data transfer error | System failure |
|---|---|---|
| Number of occurrences | 4,308 | 4 |
| Number of prevented occurrences | 0 | 46 |
| Number of detected occurrences | 4,092 | 0 |
| Accumulated amount of damages | 4,218.82 | 40,659.62 |
| Accumulated amount prevented of damages | 0.00 | 463,933.53 |
| Accumulated amount of damage reduction | 81,898.83 | 0.00 |
However, regarding the question about the net effect of the introduced controls the cumulative function statistics have more interesting information to offer because they provide data per control. An excerpt of the statistics is contained in the following table.
| Control | Double check | Backup system |
|---|---|---|
| Process folders processed | 43,199 | 43,199 |
| Number of effective controls | 41,013 | 38,884 |
| Number of successful effective controls | 4,092 | 46 |
| Accumulated amount of prevented damages | 0.00 | 463,933.53 |
| Accumulated amount of unprevented damages | 0.00 | 40,659.62 |
| Accumulated amount of damage reduction | 81,898.83 | 0.00 |
| Accumulated amount of failed damage reduction | 4,218.82 | 0.00 |
The interesting pieces of information for the analysis goal are the amount of damage reduction by the double check control and the amount of prevented damages by the backup system control. These have to be compared with the costs of the controls which can be found in the function cost statistics (not shown here). The respective values are given in the following calculations. The results are the net effects which can be achieved with the introduction of the controls.
| Control | Data transfer error | System failure | ||
|---|---|---|---|---|
| Savings | 81,898.83 | 463,933.53 | ||
| Cost | − 8,639.80 | − 17,279.60 | ||
| Net effect | 73,259.03 | 446,653.93 |
In both cases the amount of savings due to damage reduction or prevention is higher than the cost for the control, i.e. both controls should be implemented from a monetary point of view.
The above analysis is mostly focused on the monetary aspects of risks and controls. This does not mean that the capabilities of process simulation end here. A model to be analyzed could cover aspects of times and resources as well, e.g. by defining follow-up activities which are to be carried out once a risk is detected. Such activities can temporarily influence the process performance. In such a case it can be interesting to track the performance over time and how the system recovers from the occurrence of a risk event. This is where simulation really shines and has a clear advantage over a calculation which can hardly provide information about the dynamic behavior of a process. There are other details of process risk simulation which were not covered in this series of articles but hopefully it still gave you some insight into what process risk simulation is about and what can be done with it.
In case you found the articles about process risk simulation interesting and want all the content in a single document, you can download a white paper from the GRC Lounge. The white paper contains roughly the same information as the articles but is more verbose in its explanations.

Stephan Lüderitz on
Hello Mr. Angeli,
appart from the analysis, I have two questions.
In my experience the control is implemented by the following function, since the control activity is actually a part of a Workflow (in most of the cases). Why do you connect the control to the function, in which the risk occurs and why isn´t it a function in the process?
Thanks for your answer in advance