
Dies ist der Agenda-Vorschlag für das 1. Meeting der ARIS Usergroup Frankfurt/GER am 10. März 2011 im Amt für Lehrerbildung in Frankfurt a.M.
Dies ist der Agenda-Vorschlag für das 1. Meeting der ARIS Usergroup Frankfurt/GER am 10. März 2011 im Amt für Lehrerbildung in Frankfurt a.M.

Hi,
I will show all the processes in portfolio management here.
I have also covered them in my podcast at http://www.cea.podbean.com/
Cay Hasselmann

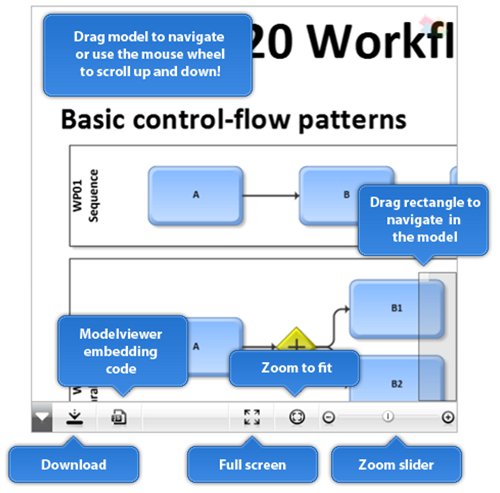
If you are a little bit familiar with the HTML5 journey, you may know that it was a long and hard way to get there starting off from the HTML 4 standard, which was not updated since 2000. The HTML5 (written without a blank) standard first introduced 2004 under the headline "Web Applications 1.0" gives us the promise to build better and more powerful web applications in the future and to be more related to practice than XHTML. Most of the modern web browser like the products of Google, Mozilla, and Apple support already HTML5 and also the next version of Microsoft's web browser Internet Explorer 9 will support some of the new HTML5 features. But can HTML5 really help us in our daily business? This is exactly the question which we have asked us in the ARIS development team and so ARIS ModelViewer was born!
ARIS ModelViewer is something like the YouTube player for ARIS models. It makes it possible to open and navigate ARIS Express models in a web browser in a very fast and easy way without starting ARIS Express itself. Like YouTube videos, you can use ARIS ModelViewer to embed your ARIS Express model in your personal page or blog and share it easily with the Internet community!
![]() It was one of the major development goals to bring ARIS models to mobile devices. We achieved this goal, because ARIS ModelViewer works well on Apple iPad and most Google Android based smartphones and tablet devices. Also, we said ARIS ModelViewer must be rocket fast, even for large ARIS models. We also achieved this goal, but try on your own. The model shown at the beginning of my article got more than 700 objects and you can still zoom and drag it smoothly.
It was one of the major development goals to bring ARIS models to mobile devices. We achieved this goal, because ARIS ModelViewer works well on Apple iPad and most Google Android based smartphones and tablet devices. Also, we said ARIS ModelViewer must be rocket fast, even for large ARIS models. We also achieved this goal, but try on your own. The model shown at the beginning of my article got more than 700 objects and you can still zoom and drag it smoothly.
You can simply upload ARIS Express models in the community in the same way you have done it before. Instead of a simple graphic, the ARIS ModelViewer will now appear in your blog post if your browser is supported (for a list of browsers see below). ARIS ModelViewer offers you all essential navigation features like you know it from Google Maps. By dragging the model or using the model overview, you can navigate around in the model. Use the zoom slider to get to see all the nasty details of the model or to take a bird's view on it. Besides, ARIS ModelViewer also provides a full screen mode so that you can enlarge it to the size of your browser window.
The following picture gives you an overview about the main controls of ARIS ModelViewer:
Some additional hints:
ARIS ModelViewer currently works with the following browsers:
We will further improve ARIS ModelViewer in the coming months. Please let us know if it doesn't work on your device so that we can check what's going wrong. We would be also happy about cool photos of running ARIS ModelViewer on your preferred device. For example, take the Super ARIS Express model in full screen mode to impress your colleagues and friends ;-)

...when people hurry along the streets and through the shops frantically searching for presents, "Last Christmas" is played on all of the radio stations, the sweet smell of fresh baked x-mas cookies is in the snowy air, and people keep lamenting: If only it wasn't so FREEZING COLD!
Well, I have good news for you: I have a recipe that will really heat you up and melt you down.
Bake at your own risk ;-)...

Such a topic could easily attract philosophical speculations. However, the intention here is to make a short and pragmatic walk within the territory that's common for this community. And I hope it will kick off some fruitful discussion.
Models in time
Let's review the all too familiar transformational tenet "AS-IS/TO-BE" with three aspects: reality, models and time. It will again be a model, inevitably a wrong one but hopefully a bit useful.
The release time T2 of a model of an existing object is normally equal or bigger compared to T1 - the modelled object's state time. Then based on that we normally[1] make several "COULD-BE" models. These are options related to future time Tn, created in T3 and T4 (see attached ADF - “time of the model”/”time of the real object state modelled”.) Of course the real object in T4 is probably different from how it looked in T1. It's good to have this in mind and do reality check from time to time to be sure that the projections are based on the right assumptions. Once confirmed that all COULD-BEs are based on solid grounds and look like viable options, they could be compared and tested through what-if exercises and simulations. Then we choose a "TO-BE" winner or make one combining the non-excluding strengths of the nominated COULD-BEs.
When this TO-BE (T4/Tn) is implemented, sometimes in stages, we have a real object in state Tn which is a transformation of the one from T1. If we model it, chances are the new AS-IS (Tn+1/Tn) will not look much like the TO-BE (T4/Tn).
Now let's see some examples of modelling time in ARIS.
Time-dependant look and position
One nice way to represent time is by changing the shape and position of on object symbol depending on time attributes. That's achieved in ARIS with attribute based modelling where an object occurrence take its place in the model based on some attribute representing point in time and the shape is changed to represent another, typically some kind of duration.
Clogged processes
ARIS Business Simulator can do wonders with simulating process behaviour based on many time attributes like processing, orientation and static wait time. One of the many benefits however is finding the process bottle necks, those places where the flow gets clogged. And the miracle KPI showing this is the dynamic wait time. It accounts for many things like resource availability, capacity, how the job is done and when.
Lost Time
Lean manufacturing focuses on eliminating various types of waste like transportation, waiting, overproduction, inventory and complexity. But then again it all comes down to lost time (and eventually money). The Value Stream Mapping, a proven technique, represents waste by turning overproduction or late production into times depending on customer demand. These times sum up to the process lead time (PLT). The time of value-added activities divided by PLT shows the process efficiency. We can test how different improvements like pulling and levelling can change that.
It's time to find the real cost
Processing time along with how many times a resource is used can show where the real overhead is compared to traditional costing methods. The process cost analysis in ARIS Business Optimiser calculates instantly the complex interrelation between structures and KPIs.
Many timelines together
We can imagine two, three dimensions and some of us probably a bit more. But that's all. The Process Support Map in ARIS IT Architect overcomes this modelling challenge by showing together timeline of many application systems in relation to the time of their support of particular process and in particular location.
Time recording
That’s probably more logical to start with than to end but anyway. Time recording recently appeared in Business Optimiser.
[1]The approach do first AS-IS then TO-BE is often criticized and sometimes rightfully. The intention here is not to promote it or discuss it. That could be a topic of another article.

Weekend is approaching quickly, so it's time for some Friday nonsense. Some weeks ago, I was looking for an easy to use tool to create a family tree. Most tools I found online are way too complex, probably targeting professional family tree creators ;-) I ended up using ARIS Express to document my genealogy. Attached to this post, you can see my results. Ok, I have to confess I'm not part of the British royal family tree, but I thought this might be a more interesting family tree to showcase than my personal one...
Some ARIS Express features come in handy while creating a family tree. I used the general diagram. Each box represents a family member. I layouted the box so that name, time of birth and death, official title, link to the Wikipedia profile, and picture have a fixed position. After finalising the layout of the box, I created a fragment so that I could easily reuse the box. Besides, I also customized the appearance of the connections used to document marriage between members of the family tree. Even though ARIS Express provides only a single connection type in general diagrams, it is now possible to distinguish between marriage and parental relationships. I only added a dummy profile picture to each member of the family tree, because I'm not sure where I can get photos of the British royals without needing to pay for it. But this shouldn't be a problem if you build your personal family tree.
My family tree of the British royals must be read from top to down. A second wife is located below the first one to document the order of the marriages. For example, Lady Camilla is located below Lady Diana, because she is the second wife of Prince Charles. I only documented the family tree of those persons, who have a direct line to Queen Elizabeth II. So Lady Diana is included, because she was married to Prince Charles, but I have not included the parents of Lady Diana.
If you are an expert of royal family trees, please jump in and help! For example, I'm not sure if the spouses of Princess Anne also got some kind of royal title. When is someone getting a royal title? Is it enough to be married to a member of the royal family?
What can we learn from this little exercise? Well, by looking very carefully at the family tree of the British royals, we will notice that there are still some opportunities for all of us to become part of this family tree. Princes Henry and William, but also princess Beatrice and Eugenie are not married yet :-)
Bearbeitungszeiten werden durch System errechnet
Durchschnittliche Verweildauer der Kunden = zweite Hälfte Timestamps - erste Hälfte Timestamps durch Anzahl Kunden
Anzahl Kunden = Timestamps / 2
Hallo,
ich beschäftige mich erst seid kurzem mit dem GPM und habe mich an eine kleine EPK gewagt. die Frage, die sich mir nur stellt: Ist das ein syntaktisch korrekte EPK?
Und eine weitere Frage hätte ich noch. Gibt es ein offizielles und aktuelles Werk, wo ich eine genaue Beschreibung der EPK-Syntax und EPK-Symbolik finden könnte.
Mit freundlichem Gruß
Daniel Aufermann
Hello everyone,
I would like to share with you a BPMN collaboration diagram model for the BPA Export process. This process is related to the Brazilian healthcare industry, and is regularly performed by the healthcare providers (such as hospitals and clinics) contracted by SUS (Brazil's government-funded healthcare universal system). BPA stands for Bulletin of Ambulatorial Production and it is a production report consisting of detailed records of all medical procedures performed by the executing organization within a certain period (named monthly billing competency).
This production report must be delivered successfully validated according to several business rules mandated by SUS (such as, a given medical procedure must comply with certain ICD-10 codes). In the diagram, they are grouped within a sub-process called BPA Consistency and are not detailed for the purposes of this exercise.
I also modelled a rather complex activity which is a messaging broker acting as a relay/control in order to give to the end user full flexibility in executing the process, considering that upon validating each business rule certain user-defined parameters can be verified according to the validation resulting message. The message will then be sent to the messaging broker, which will verify if:
- which process can be triggered according to the message processed;
- the message must be shown to the user on screen;
- the message must be recorded in the audit trail;
- the message interrupts execution;
- additional messages that must be sent to external participants;
- etc.
Now, I would like to highlight some issues that I faced while drawing this diagram.
1. Converging sequence flows to a single point is rather difficult. For an example, each of the initial 3 tasks trigger an error event that must be sent to the messaging broker in another pool. In fact, as I stated earlier, any message must be to the broker. Initially, I tried to draw the message flow accross the pool boundary but the receiving object would accept only up to 3 connections. Then I tried an alternative - link event - and it seems to work, although now the message flows crossing the pool boundaries are not explicit.
2. Drawing result triggers with the task boundaries is neat, but adding too many events to it can make the model difficult to read, considering that a task can trigger several result messages (error, complete, business rule validated, business rule not validated, etc.) which is the case. Another issue with this point is that adding a description to the event can also make the model difficult to read due to weird positioning.
3. For readability purposes, I used exclusive gateways to converge message events that would be then sent as a single object to the messaging broker. I also did that with link events, and perhaps the later form is better because using gateways can imply that a decision has been made in a previous point.
4. Also for readability purposes, considering that each message event can have content AND/OR an user-defined interruption flag, I used an event gateway to split it, thus assigning the meaning that the system will behave according to the message's content and execution flag contained within.
5. For a message where content and execution flag (or 2 or more messages that are bundled together) are mandatory, I used the parallel multiple event. I am not sure if a signal event (which is not explicit in most of the diagram) can be instantiated in runtime, because the signal event behavior is set by the message's execution flag. A workaround would be drawing the signal event along with the message event, as you can see in the end of the Messaging pool. If semantically correct, a neat way would be drawing the parallel multiple event to assign the meaning that several events are contained within that must be treated in blocks. In programming (at least in C++ programming) this relationship can be implemented using a simple data structure (a matrix record with pointers).
6. BPA Consistency sub-process is a loop activity, because it goes through multiple records validating each one and verifying its compliance with SUS' business rules. It is unclear to me whether the loop conditions must be drawn within the sub-process or outside it. Thus, the BPA Consistency activity and its related objects may be incorrectly modelled in this diagram, considering that the messaging broker could be called within its execution flow. In order to make it work in that way that is designed now, BPA Consistency should be designed as an external sub-process thus requiring a call activity, which would control the loop execution, but in that case several tasks and some gateways would be necessary to be model the loop, thus effectively making the call activity a sub-process.
7. I've read several posts on the Web by people complaining that BPMN 2.0 is too difficult for the common business user. I completely agree. From a business user perspective, he or she would lose it when seeing the weird markers on gateways, or the crosses on the events. Being myself a systems analyst with a decade's experience as a business consultant, considering that sometimes it's difficult to keep the two perspectives apart when modelling systems, my "business user persona" could not intuitively relate some established concepts/practices to BPMN 2.0 concepts, such as Exclusive AND is implemented by the parallel gateway. Other than that, I believe that BPMN 2.0 is a great tool that can empower the work of process consultants, but at least here in Brazil "many waters will flow below the bridge" until we see BPMN becoming standard practice mainly because notation languages are not regular courses on the curriculum of educational institutions, and most of business users (specially those that work in the process-complex healthcare industry) are unable to draw even a basic workflow diagram. This is a true fact accross the organization, from bottom to top.
In closing, I would like to thank you in advance for any inputs/commentaries that you may want to add.
Cheers,
Wendel Souza